placr tube-radar

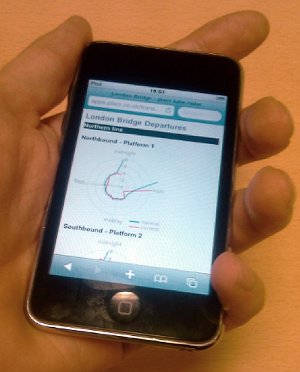
placr Tube Radar on an iPhoneHere’s something I’ve been working on at placr:

>>>> placr.mobi <<<

[Update:placr.mobi is a bit different these days, but the tube stuff is actually available at http://placr.mobi/timetable?u=uk%2Ftube ]

Have a play with it. The site is designed to work well on mobile screens. You can get to it by typing “tube-radar.com“. [update: These days that’s also something different. Sorry for the confusion]

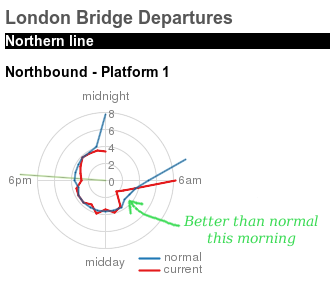
The red and blue lines indicate tube performance in terms of “headway”. The time between trains. Closer to the centre means shorter headway (good!) further from the centre means… waiting around a while.


placr Tube Radar at London Bridge

You can compare the data over the past 24 hours (red) with the “normal” levels (blue) which are averaged over a longer time period, but at the same platform and same time of day. Hopefully this will give an indication of how good or bad or erratic your service is likely to be today.

If you’ve chatted to me about what I’ve been doing at placr, you’ll have noticed I’m fairly hopeless at describing it. So hopefully this will give you a better idea, although this is only part of part of what I’ve been doing. We decided it was time to bring some stuff to the public-facing surface from one of our projects. We’ve spent a while gathering and analysing performance metrics of the tube, and this is one kind of output we’re seeing. To get this out in time for the tube strike was a bit of a last-minute rush, so it may look rough around some of the edges, but here’s hoping some people will find it useful (or at least interesting) over the period of the tube strike.

Trip to Shanghai

Last week I went to China. You know, that place where everyone lives. In fact I was in Shanghai, the most populous city in the world (by some definitions)  I’m kind of ashamed to say it’s the first time I’ve been to Asia. My bounding box just got a whole lot wider. I was invited there to give a talk on OpenStreetMap and the Haiti story, which was a fantastic opportunity in itself. I shall blog more on that (coming soon)  but just being in this mega-city was an amazing experience, helped along by some excellent hosting.

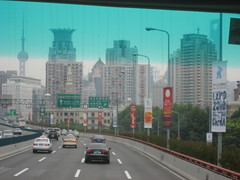
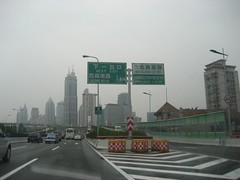
Buses and taxis whisked us around the brightly lit streets. I was always impressed by the neon-lit multi-level flyovers and spaghetti junctions:

Shanghai Shanghai flyovers Shanghai Shanghai

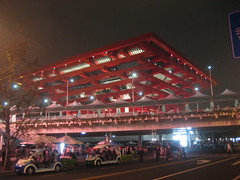
We had  a trip to the Shanghai Expo. VIP access allowed us to mostly skip the gigantic queues, although amusingly we were denied this at the UK pavilion:

Shanghai Expo Shanghai Expo Shanghai Expo UK

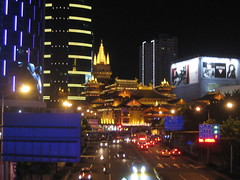
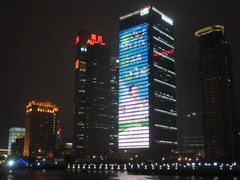
We had some time to take in other Shanghai sights. The night-time boat trip was particularly spectacular:

Shanghai Shanghai Shanghai temple Shanghai

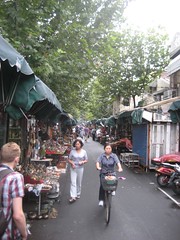
We had a look around the antique market and other shopping areas:

Dong Tai Road antiques market Shanghai Ancient chinese shopping plaza

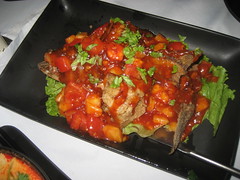
We had some wonderful (and sometimes weird) chinese meals:

Fish in sweet sauce Roast Duck Moon soup No english menu

All in all a pretty spectacular travel experience. I thought I’d put a few photos here in case you missed my usual showing off live-photo-streaming while I was out there. More pictures on flickr.This wasn’t a holiday though. As I said, I need to follow this up with some more details of the OpenStreetMap talk I gave, and thoughts from the conference.

Talks and thoughts on OpenStreetMap mapping parties


(photo Copyright All rights reserved by SINFOGEO)
A few weeks ago we had a big OpenStreetMap conference, the annual “State Of The Map”. This year it was in sun-baked Girona. “State Of The Map 2010 felt like a coming together of all my OpenStreetMap friends from around the world” Read my more detailed write up over on my user diary. There was a diverse variety of talk topics, from OpenStreetMap technical nitty-gritty, to big business GIS uses, to worldwide travels and humanitarian mapping. The full list of sessions is here. My talk this year was part of the “community track”.

Party Time! Good and bad ways to run OpenStreetMap mapping parties

UPDATE: Video of the talk is now available

I seem to have become the chief event organiser for OpenStreetMap in London, not because people massively admire the way I do it, but because it’s actually fair amount of effort, and I’m the one who got suckered into doing it. So this talk was mostly about my experiences of running these regular “mapping party” events, which we do every two weeks as a “mapping party marathon” (Sounds interesting? Check out when the next one is!)As I stressed in my talk, my approach is not ideal. There’s lots of things I don’t get around to doing. In particular I haven’t really tried to drum up press coverage of events. For one reason or another we never have very much luck at attracting new poeple. Although we try to be welcoming to new faces, it mostly ends up being a fun social meet-up where people know eachother. In the questions I was asked “what are my ideas for attracting new people?” to which I gave a hand-waivey response, but the truth is I don’t really know.


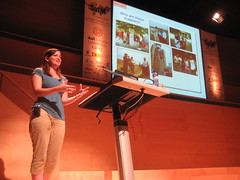
So I thought it counterpoised my talk quite nicely when Thea Clay got up and talked about outreach to non-technical communities and spoke about some of the successes she has had reaching out to local community groups and attracting new people to mapping parties in the U.S. This seems like a direction we need to go in, and I hope to find time to try this more in London. But then again…

Ultimately I think the most important message she had, was that OpenStreetMap is too difficult for non-techy people. They get the idea of creating open maps. They enjoy the outdoor aspect of data gathering, and they will have a lot of fun when you first take them out to do this, but the minute they sit down and take a look at our map editing tools “you can see the look on their faces change”.

Perhaps then the most important role of OpenStreetMap events, is to foster the existing OpenStreetMap community in an area. I would even go as far as saying that most outreach work at the moment should target boring old techy people and developers.

This is not the end game. We absolutely want to attract young people and old people, mothers and grandmothers, but getting techy people excited about OpenStreetMap is easier and actually far more effective than anything else at this stage. They’ll learn the tools quicker. But more importantly, these are the people who will go out and embed OpenStreetMap in their websites, taking it to new audiences, or if we’re really lucky they’ll go on to help solve the technical problems of OpenStreetMap and make the next useabilitiy break-throughs.

Obviously any publicity is good publicity. Any mapping party is a good mapping party, but I’m trying to consider where effort is best spent. Are we getting ahead of ourselves to try to engage with local community groups? Maybe I’m just working the geek angle, because that’s what I know best. As I said in my talk, press is important, and press (or PR?) is something OpenStreetMap needs to get better at.

Ruby code for converting to UK Ordnance Survey coordinate systems from WGS84?

Ruby code for converting to UK Ordnance Survey coordinate systems from WGS84? It’s one of those things I’d assumed would be a five minute search -> cut-n-paste job. But no. Well now you can cut & paste from here.

Using Proj4 and the proj4rb bindings

You can do all manner of coordinate projecting using Proj, and this is available within ruby code via proj4rb. To get set-up, install proj. On ubuntu you can do:

sudo apt-get install proj

download the proj4rb gem file (the ruby bindings), and install the gem:

sudo gem install proj4rb-0.3.1.gem

To use in a plain ruby script:

require 'rubygems'

require 'proj4'

To use in a rails app, add a line to your environment.rb file

config.gem "proj4rb", :lib => "proj4"

Probably all obvious to any pro-rubyist, but I got stuck at various stages of that. Anyway once you’re set up…

This code will do a conversion from WGS84 lat/lon to eastings and northings:

lon = -0.10322
lat = 51.52237

srcPoint = Proj4::Point.new(Math::PI * lon.to_f / 180,
                            Math::PI * lat.to_f / 180)

srcPrj  = Proj4::Projection.new("+proj=longlat +ellps=WGS84 +datum=WGS84 +no_defs")
destPrj = Proj4::Projection.new("+proj=tmerc +lat_0=49 +lon_0=-2 +k=0.9996012717 +x_0=400000 +y_0=-100000 "+
                                      "+ellps=airy +datum=OSGB36 +units=m +no_defs")

point = srcPrj.transform(destPrj, srcPoint)

puts "http://www.openstreetmap.org/?mlat=" + lat.to_s + "&mlon=" + lon.to_s + "&zoom=16"
puts "Converts to:";
puts "http://streetmap.co.uk/grid/" + point.x.round.to_s + "_" + point.y.round.to_s + "_106"

Originally I was trying just the ‘destPrj’ string, and calling the ‘forward’ method, but this seemed to be skipping the datum conversion, resulting in everything being 100m out. It seemed to be necessary to use the ‘srcPrj’ string and the ‘transform’ method, to get the datum conversion happening.

You can look up the mystical proj strings on spatialreference.org

(UPDATE)  If you’re interested in converting in the other direction, using the proj4 gem, see Peter Hicks blog: Converting OSGB36 (Eastings/Northings) to WGS84 (Longitude/Latitude) in Ruby

A pure ruby implementation

Like many naive developers who have gone before me, I started out thinking that these coordinate transformations should be acheivable with a few simple formulea, and was expecting to be able to copy & paste a block of ruby code from somewhere to do it without installing any gems.

I didn’t find any such code, but frustration with proj problems (before I got that working) led me to create a pure ruby solution, by porting this pure javascript code by Chris Veness into ruby. So there we go:

osgbconvert.rb – Conversion to Ordnance Survey coordinates in pure ruby

You can run it to see an example conversion with the output:

wgs84 lat:51.52237, wgs84 lon:-0.10322
http://www.openstreetmap.org/?mlat=51.52237&mlon=-0.10322&zoom=16
Converts to:osgb36 lat:51.5218609279112, osgb36 lon:-0.101610123646581

Converts to:easting:531691, northing:182090  As a grid ref:TQ31698209

http://streetmap.co.uk/grid/531691_182090_106

This includes ported code for Convert co-ordinates between WGS-84 and OSGB36 and ported code in one direction for OS Latitude/Longitude to OS National Grid (coordianate systems explained below) Also I haven’t faithfully stuck to what Chris’ functions return.

There is a bunch of maths, but it was quite a straightforward syntax conversion, and it comes in at about 150 lines of code. Somebody should do this for other languages. I’m sure other languages offer more beefy libraries equivalent to proj4. The main benefit of this is for quick copy & paste coding.

Mind you, if you are copying and pasting this, be sure to worry about the fact that it is LGPL licensed by Chris Veness [Update: It’s now shown under the more permissive CC-BY license on his website. Take your pick!]  For my part, you can credit me too if you like, but I don’t care.

I also came across another implementation, license unknown.

About Ordnance Survery coordinate systems

Chris Veness’s page is well linked because the code comes with a comprehensive description of what’s going on. However I misunderstood a few things even after reading it several times. Here’s my noddy guide to Ordnance Survey coordinate systems:

WGS84 is what I would call the “normal” latitude and longitude coordinate system. These days web developers passing around latitude and longitude values are normally using this. It’s what OpenStreetMap works with if you want to point to a location with a URL such as : http://www.openstreetmap.org/?mlat=51.52237&mlon=-0.10322&zoom=16 (the placr.co.uk office).

Ordnance Survey OSGB36 – Involves coordinates which are also called “latitude and longitude”. The numbers look very similar, and in fact if you get them confused and use one in place of the other, you’re generally only ~100 metres off. At this point I could mention “datums” and “ellipsoids”, but who cares? How do we fix it? With the above ruby code, use the function convertWGS84toOSGB36 (or convertWGS84toOSGB36 in the other direction)

Couple of formatting things to note: Both WGS84 and OSGB36 latitude & longitude values can be expressed in degrees and minutes rather than decimal, and with N S E W letters on the end. For example 51°31′20.53″N 000°06′11.60″W If longitude has a W on the end it would more “normally” be a negative number. The letters on the end do not make this an “Eastings/Northings” coordinate. That’s a different system…

Ordnance Survey National Grid Reference Eastings and Northings look totally different. For the placr office the easting is 531691. The northing is 182089. On these numbers the first digit is special. It’s identifying which “grid” square we are in, counting from zero. Everything in London is in grid square 5,1

National Grid References with letters are the older more human friendly version of that. So “TQ 3169 8208” is the equivalent. The 5 and 1 are removed, and instead we represent the grid square separately at the front. Everything in London is in grid square “TQ”. Just to munge things together a bit more, we might drop one digit of precision and drop the spaces to give “TQ316820”.

Don’t ask me how Landranger sheet numbers fit in. I’m going back to my WGS84 thankyou very much.
Aid Information Challenge

I’m at the Aid Information Challenge day watching the final hack presentations. This seems to be part of a series of hacking events happening at the Guardian offices, following on from rewiredstate National Hack the Government day (where I made the find my nearest registry office/hospital thingy).

The idea is to get techy types to meet with people from other areas, in this case aid organisations, and look for ways to bring their skills to bear, preferably in the form of super-quick super-agile thrown-together-on-the-day “hacks” which get presented at the end. I probably should have got more involved in a mapping hack. There was a fair bit of this going on, and I got into a few conversations. Lots more potential for OpenStreetMap hacking and promoting OpenStreetMap by getting it into projects.

Instead though. I mostly busied myself with throwing together this slide deck “OpenStreetMap For Aid Information” which I then presented:

OpenStreetMap For Aid Information

I originally thought I’d have two minutes to talk at the end of the day, but I actually talked for 20 minutes as a side-line talk during the day.The main emphasis of my talk was on two nice recent aid information examples Haiti and Kibera. Some related links:

I also mentioned London events.

placr

For the past few months I’ve been doing some work for placr, and this week I’ve joined the team full-time.

Placr

I’m working on a new transport related API *, with some interesting geolocation and realtime dimensions to it. Currently this is all aimed at partner projects and B2B type clients, so I’m afraid there’s nothing fun to show you yet. Hopefully we shall go public with an API at some point, but it’s not the priority at the moment.

The work is very interesting, and now that I’m not splitting up my week with other things I can try to build up a bit more momentum. We’ve been starting from scratch.  A fresh subversion repo! I wanted to build a RESTful API outputting both XML and JSON, so I’m doing this in Ruby on Rails. I settled on this after doing some experiments with django piston first. Some interesting problems encountered with both though (despite this being very much core to what these frameworks are supposed to be good at)  Still plenty of framework details to work out, but it’s all good fun. I’ve also been using various libraries for HTML scraping.

The team is following (and getting involved in) the various open government data debates, because we’re looking at making use of some of these datasets. These are a moving target at the moment though, so as we look to develop on top of these things, agility is going to be important.

* What’s an API?

These days I’ve been socialising far too much with techy people, and was rather taken aback when someone (might have been my mum) interrupted me in the middle of my well rehearsed little job description to ask “What’s an API?”. It stands for Application Programming Interface.

I rather liked the way Richard Boulton described it as he demo’ed his API at last weekend’s rewired state event. Pointing at a this screen full of data he said “It may not look very nice to you, but to a developer this is beautiful”. That particular screen full of JSON formatted registry office data did look beautiful to me, so I developed this thing last Saturday. An example of an API and an application built to use it.

WhereCamp.EU How was it for me?

WhereCamp.EU Logo by Sophie GreenWhereCamp.EU was pretty mind-blowing. I wrote a few posts to the official site during the event:

From a personal perspective it was massively enjoyable and rewarding, but the whole thing flew by too quickly. Preparations started months ago, but suddenly on the day there was so much to do, and at the same time so many people I wanted to chat to and fascinating sessions I wanted to see.

It got off to quite a blurry-eyed start due to geo-curry with the team the night before, followed by staying up late to prepare slides. As organisers we decided we would need to seed the unconference “wall” with some post-it notes in the first session slot, to get things going and spur other people to participate by setting an example. This meant I was feeling stressed and tired from the off, but it worked well, and despite a lot of people being new to the unconference style, a great atmosphere of participatory buzz carried the proceedings forwards at an alarming pace.

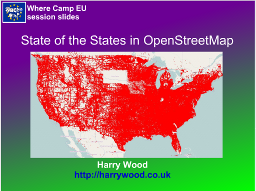
You can read more about my session “The State of the States in OpenStreet Map” on the WhereCamp.EU wiki

state-of-the-states.png

This got a pretty small audience because I was up against some awesome sessions from the other organisers, but I guess I’ll get the opportunity to re-use some of these slides on some other occasion. I might change the background colour. I’d had a few beers with the geo-curry, and the purple-green gradient seemed like a good idea.

I also contributed to the OpenStreetMap Q&A Session (mainly by asking the first question)

On the Saturday I ran another little session called “OpenStreetMap Practical – Never edited OpenStreetMap? Bring your laptop and we’ll show you how”, which kind of worked, although it clearly needed longer than the 15 minutes we had.

The event left me completely shattered, and I was quite surprised when I popped into the pub for a quick pint afterwards to be confronted by a massive crowd of geo-people all enthusiastically continuing the discussions.

I’ve just been checking out some blog responses and write-ups of the event: Gary Gale (vicchi.org) , Guardian Open Platform blogEd Parsons , Steven Feldman (giscussions) , jokru , Eamonn Neylon , James Cheshire (spatialanalysis.co.uk)  As I say, from my perspective the whole thing flew past very quickly and it was quite difficult to know whether the event was actually going well, so it’s gratifying to know that people enjoyed it, and found the format successful.

WhereCamp.EU tomorrow

WhereCamp EU is tomorrow! I’ve been organising the posters:

We have a small team of organisers who are all people from the London geo-conference/meet-up circuit. In particular we have Chris Osborne who frequently puts together the very popular #geomob events, and Gary Gale who seems to live his entire life at geo conferences. These combined with a team of five or six others (including myself) have come together to plan two days of geo-map-technology goodness.

We were very successful with our marketing of the event before and during release of the tickets. Maybe a little too successful. It’s a limited capacity venue, and it is very much at its limit. Some people were slow to book their place. These people …well you can’t come (especially Steve)   Sorry about that 🙁

The posters involved lots of fun playing around with sponsor logos (In truth it was only fun at first, and quickly became a big hassle. But anyway)  We are of course hugely grateful to these organisations:

Gold sponsors: GoeVation & OS OpenSpace, and Guardian Open Platform.

Silver sponsors: Axon Active, bing maps, ERSI UK, Google Maps, data.gov.uk.

Bronze sponsors: DBVU, ito, nestoria, SVGOpen, and Yahoo! Developer Network

Being an “unconference” we haven’t actually planned the content of the conference in a lot of detail. This is where we’re relying on the imagination and motivation of the attendees.

“The attendees drive the content of the sessions on the day instead of having a prescribed schedule and set of content. Therefore, the event is what you make of it, and is only as fun as the people who attend. So be prepared to speak and contribute.”

This may sound chaotic, but I’m reliably informed that it does actually make for an fun and fulfilling event. Looking down the list of attendees, I can see that there will be plenty of amazing ideas. Should be a fair amount of OpenStreetMap related stuff hopefully. I’m excited to see what kind of sessions people come forward with.

Haiti Earthquake on OpenStreetMap

In last week’s blog post I casually mentioned the Haiti earthquake, and how we had a little project going on, to improve the map of the area on OpenStreetMap. Since then the scale of the disaster has become clearer to me. 200,000 feared dead, and the story has been top of the news headlines all week. In keeping with this, the response by the OpenStreetMap community has been impressive, with massive mapping progress in a very short space of time. What started out for me as a little casual doodling in of streets in Yahoo! imagery, has rapidly turned into a collaboration of hundreds of mappers using post-quake aerial imagery.

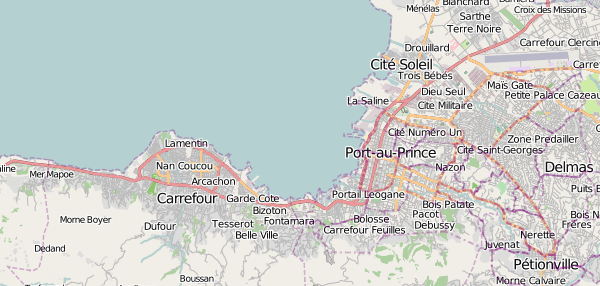
Port-au-Prince Haiti on OpenStreetMap
 
Within 48 hours we had a very complete looking map of Port-Au-Prince and Carrefour. Mikel Maron drew attention to this progress with a classic before and after map comparison, and I’ve seen and heard several people expressing surprise and amazement at the speed of the OSM response. Knowing how the community works, I actually didn’t find it that surprising. In fact next time we respond to a disaster, now that people get the idea, I’d hope we could turn around this kind of mapping progress within 12 hours. (or within 12 hours of accessing good imagery).

For me the exciting thing about this past week, has been an increase in recognition of OpenStreetMap as a valuable source of map data. In a scramble to help by providing GIS expertise, many organisations have come to OpenStreetMap as the best source of data. More exciting than that (so amazing!), is to get a message of thanks from some people running search and rescue teams, who have loaded our data onto Garmin units to use on the ground. See Uses of OpenStreetMap data by crisis responders for more examples.

The important point to stress here is that OpenStreetMap is offering map resources covering the Haiti Earthquake in a variety of formats. You can browse the map as conventional fluid web interface, but our open data allows us to do so much more than that.

  • We can offer downloads of raw OSM XML data, ESRI shapefiles, Garmin img. These are listed at the top of that page. Well done to GeoFabrik for responding quickly with their specialised Haiti downloads service
  • Mobile devices across many platforms can make use of our data or map images. See this section and the main ‘Software for mobile devices’ list. People heading to Haiti for rescue and recovery missions, should juice up their devices with this good stuff!
  • We can render the map in different ways. User:Ldp set up haiti.openstreetmap.nl as a custom Mapnik rendering showing building damage and refugee camps. These are special tags invented for the purposes of recording this information using OpenStreetMap’s open tagging approach
  • We can provide rendered maps tiles for use in online apps. Anyone setting up a website e.g. to help with the earthquake response, can display OpenStreetMap maps in much the same way as embedding a google map. (It’s a little known fact that you can even use Google Maps API to display OpenStreetMap tiles. See Google Maps Example)
  • We can offer maps files for printing. The list of printable files includes vector formats (SVG and PDF) and high resolution raster images offered by me! This was my main technical contribution over the past week (assuming you don’t count wiki link fiddling as technical!) I set up some hi-res map images of Port-Au-Prince and Carrefour and a script to rebuild the image with updates every hour. At the time I hadn’t noticed GeoFabrik had done the same thing, but they’re covering different areas and larger images, so it’s all a good variety of offerings.
  • We can set up other types of customised geo services for Haiti using OpenStreetMap’s raw data. Check out Open Route Service Haiti and Nominatim Search for Haiti

A lot of these things were possible using the collective expertise of the OpenStreetMap community who, uniquely, have become fully accustomed and experienced with having access to raw map data.

I mentioned 48 hours as an approximate measure of how long things took, but as ever with OpenStreetMap, things are never really complete. The mapping efforts in Haiti are very much ongoing, and you can help! Check out the Haiti project page for details. We’re mainly looking at mapping more outlying country roads, anything new you can find to sketch within the various imagery sources, but also making use of some other sources e.g. street naming from U.S. military maps. If you’re new to OpenStreetMap mapping you’re very welcome to get stuck in, but be prepared to climb a bit of a learning curve with the editing software (set aside an hour)

But we need to get the message out about the map resources I’ve listed above. I think that’s more important than encouraging people to join in with mapping at this stage The Fairfax County Urban Search & Rescue Team in their message said “Please be assured that we are using your data – I just wish we knew about this earlier”.


UPDATE: I’ve written about OpenStreetMap and Google MapMaker in Haiti in relation to the wasted duplication of effort split between the two communities (and relating some other blog posts on the topic here and here and here)

The developing world on OpenStreetMap – Armchair mapping possibilities

One of the most interesting aspects of OpenStreetMap is its global scope. The whole world map is editable wiki-style, and the various techniques for creating maps can work just as well in Niarobi and Nagpur as they do in Newcastle and New York. The project has always been most active in countries like the U.K. where we have lots of commercial map data but want free map data. Often in developing countries there is some commercial map data, so the same considerations apply, but then there are places which have just never been mapped by anyone. It’s quite difficult for me to imagine living in an city without ever seeing a map of that city. But many people do, and presumably they don’t really know what they’re missing. They’re missing a basic information tool for planning development, supply lines, day-to-day life.

Mikel Maron is back from the slums of Nairobi (specifically a massive slum called Kibera) where he has been working with local people on creating the first ever map of the area. His blog post ‘Some notes on Map Kibera mapping‘ gives a hint of some of the amazing stories he has to tell from this experience. No doubt he’ll give another great conference presentation about it.

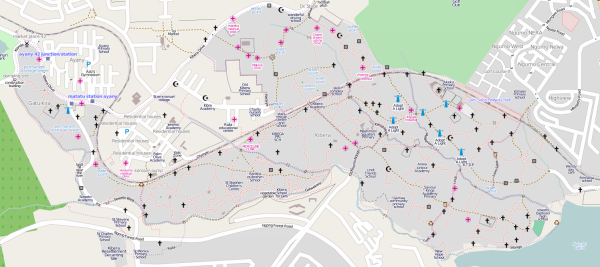
Kibera Map

He created the Kibera map using OpenStreetMap of course, and I’m proud to say I had a hand in it. He got me to help out from afar, by sending me a link to some high resolution aerial imagery (special imagery which he’d got hold of, which was better than Yahoo!’s), and I traced over some of the basic details, the roads and footways I could see. This was used as a starting point for on-the-ground surveying work which he taught local people how to do. Yesterday Mikel completed the process of uploading all of this onto the main OpenStreetMap server. (See the map)

With OpenStreetMap we can build great maps of developing countries. We can do it ourselves (remote mapping) or local people on the ground can survey the streets. Or some combination of the two. Remote mapping A.K.A. “armchair mapping” by sketching over aerial imagery, is a good way to build a basic map quickly. It’s a sensible first step even if you’re in the area, but of course it doesn’t matter where you are sitting, or which bit of the world you are mapping (although availability of aerial imagery is a limitation) Another point which bears repeating… you don’t need a GPS unit! Gadgets are fun, but armchair mapping is easier and more accessible than that. Anyone with internet connection can get involved.

If you’re looking for ideas of where to do some remote armchair mapping, the Humatarian OpenStreetMap Team page lists some possibilities. Often this involves mapping of disaster zones. At the moment we are trying to quickly improve our map of Haiti after the earthquake which happened there yesterday. Google maps have good coverage, but the hope is that our open licensed maps and open access to the underlying data might be useful in some small way for aid agencies responding in the short term or to local people as they recover from the disaster in the longer term. In addition, we have the potential to produce maps which are more up-to-date (e.g. showing collapsed bridges) if we get some information from people on the ground. We can also map details which google maps don’t normally show, where such things are recognisable from the sky. We’ll need to boost the general completeness of our map before any of that can happen though.

Beyond that, there’s plenty of armchair mapping to do in the developing world. There’s a list of cities with Yahoo Aerial Imagery coverage (We are allowed to use Yahoo!’s imagery for OpenStreetMap) Any city in India could probably do with some help, apart from Chennai which is beautifully mapped!

If you prefer armchair mapping closer to home, there’s things like tracing U.K. rivers from NPE or wade into the big TIGER fixup job in the U.S.

Endless mapping possibilities available directly to you in your armchair, so get stuck in!