A week ago I got together with Steve Chilton and Steven Feldman and gave an OpenStreetMap training course to a handful of enthusiastic young people who were about to head out to Ghana as volunteers with a charity called tzedek.
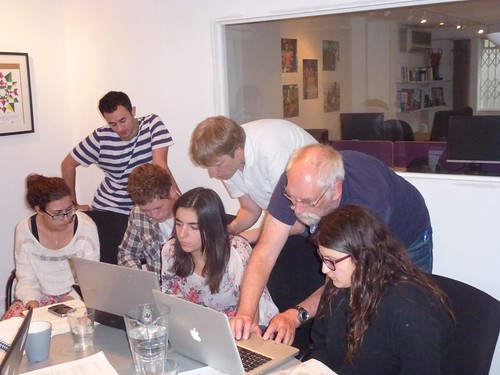
Photo by Steven Feldman CC-BY NonCommercial
I’ve done similar things before but nothing exactly termed a “training course” actually. It was pretty similar to the UCL Masters Student mapping party Sept 2010. Back then I was asked to kick things off with an introduction, and had to stand up and make something up on the spot. This time I had some slides prepared.
Which slides? Well maybe I should’ve just used learnosm.org teaching resources for this. I took a look at them, but I decided I wanted to say a bit more in the intro sessions (perhaps wrongly actually). The learnosm.org slides are the product of years of experience mostly by Kate Chapman giving training courses out in Indonesia. But I think slide decks are actually quite a personal thing. I have my own way of introducing OpenStreetMap, and maybe more importantly my own images which trigger memories of what to say. Having said that, maybe I can work on putting some of my ideas into the learnosm.org slides, perhaps to provide a longer slide deck for those that want it. And of course I’d love it if anyone else found my slides useful and wanted to re-use them in any way.
So I’m going to blurt them all out onto this blog post, as I have done in the past. I’m in two minds about doing this because I really just wanted to record the slides that I showed at this particular event, and have somewhere to link them. It’s good if this disappears into the archive over time, because it’s a work in progress. It’s also the same slides I have blogged before in the past, but arranged a bit differently, so to some people this will just be a very big repetitive intrusion onto blogs.openstreetmap.org. Apologies!
Download slides as Libre Office .odp file (25 Mb)
Jump to slide:
1, 2, 3, 4, 5, 6, 7, 8, 9, 10, 11, 12, 13, 14, 15, 16, 17, 18, 19, 20, 21, 22, 23, 24, 25, 26, 27, 28
Slide 1
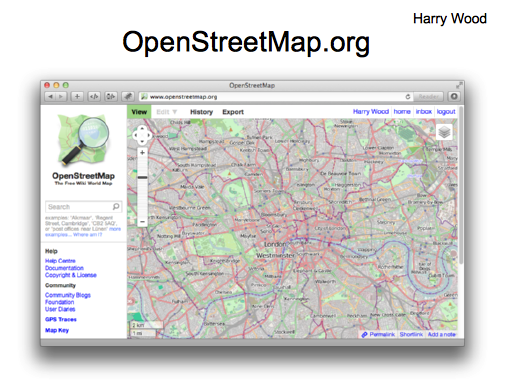
So I’m going talk about OpenStreetMap. Check out the website at OpenStreetMap.org
Slide 2
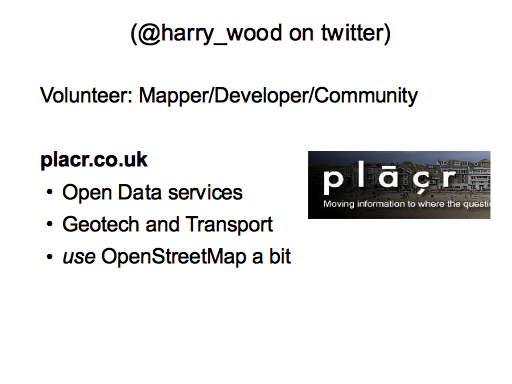
I’m an OpenStreetMap enthusiast and volunteer. I’m very active within OpenStreetMap and within the Humanitarian OpenStreetMap Team. It’s not my job though.
For my day job I work a small startup company http://placr.co.uk We do a lot of work with open data, geo technology and transport related stuff. So I do get to use OpenStreetMap sometimes with day to day work, but essentially I do OpenStreetMap in my free time as a volunteer.
Slide 3
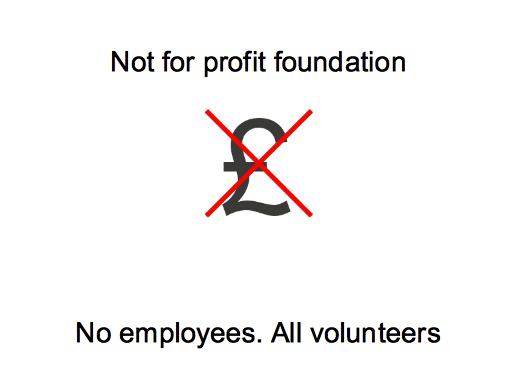
And that’s typical. There aren’t any employees of OpenStreetMap. Everyone takes part as volunteers. Only spare time volunteers in fact.
It’s important to realise, this isn’t a product pitch from a company called “OpenStreetMap”. OpenStreetMap is a very loose-knit nebulous community of thousands of map enthusiasts. At it’s core there is a not-for-profit organisation called the OpenStreetMap foundation. Overall the project has a “good cause” mission to map the world and release the data for free
Slide 4

OpenStreetMap was born here in the UK because people wanted, not just a map, but open licensed map data which they’re free to use. To do this, we have to create new map data without copying from existing maps. So even though we have great maps of the UK, people did this crazy thing of going out and surveying the world to create a new map from scratch.
So that’s the reason OpenStreetMap exists. It’s all to do with map data
Slide 5
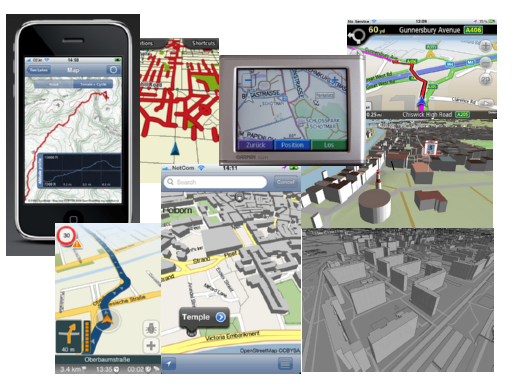
Obviously that’s a bit technical, but basically if we can give people free access to map data then they can do wonderful creative experimental things… Things in 3D… Things on mobile devices…
skobbler.de, navmii.com, uktraveloptions.com, Rostock 3D, and others.
Slide 6
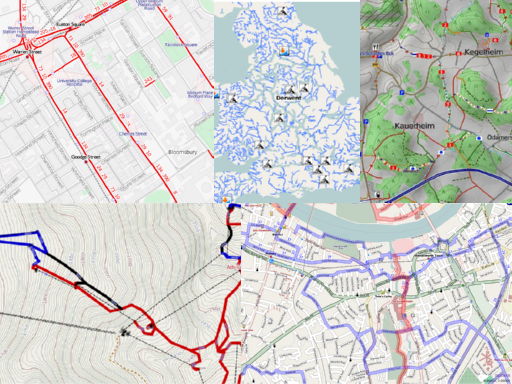
One really nice thing which is possible with OpenStreetMap data, is creating a new view of the map. In a process called “rendering” you can take the raw OpenStreetMap data and show the map in a different way, pulling out different features to show.
So OpenStreetMap is not just one map. It’s all about data, and many different uses of that data.
Thunderforest whitewater.quaker.eu.org,
OSMC Reitkarte, OpenPisteMap.org OpenPisteMap OpenCycleMap.org
Slide 7
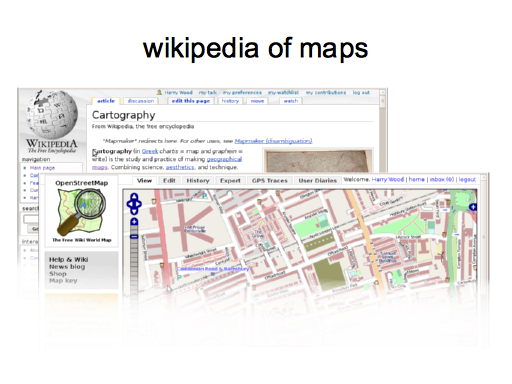
But the aspect of OpenStreetMap you may find more interesting, is the ability to edit the map. OpenStreetMap is the wikipedia of maps. Wikipedia is an encyclopedia which anyone can edit. We have a map which anyone can edit.
Slide 8
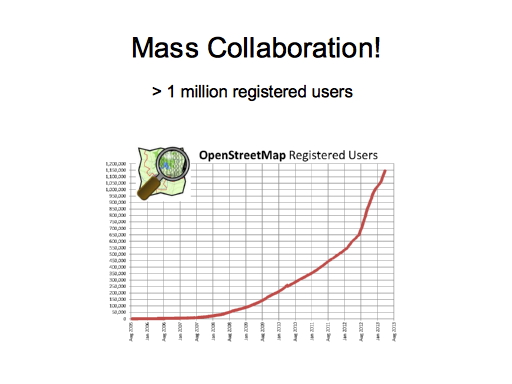
Like wikipedia we do mass collaboration. We have over a million registered users. These people can all edit the map.
http://wiki.openstreetmap.org/wiki/Stats
Slide 9
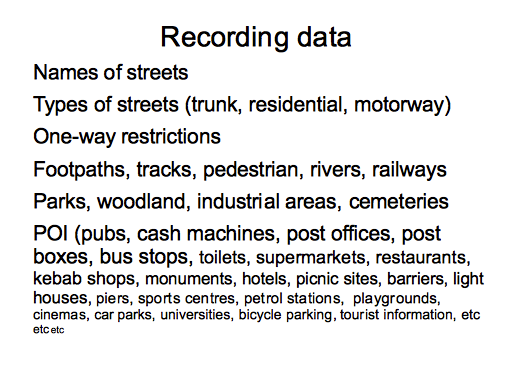
We need lots of people because we gather a lot of data.
It’s not just basic street map data, it’s landuse coloured areas of the map, and all sorts of “Points Of Interest” details.
We’ll get a better feel for what kinds of things to add as we look at mapping later on.
Slide 10
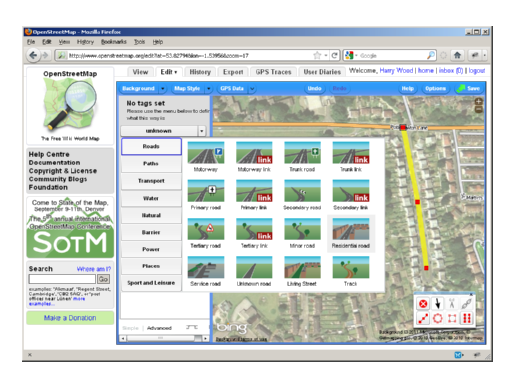
To get lots of people involved we try to make the process of editing very simple. We’ll be learning to use an OpenStreetMap editor. Hopefully you’ll find it fairly simple. Maybe you won’t, but certainly its easier than some systems. You don’t need a degree in cartography to use it. By keeping it simple we get hundreds of thousands of people involved.
Slide 11

Everything in OpenStreetMap is made up Nodes and Ways, and these things have Tags on them.
A node is a single point. It can be used to represent something like a pub.
A way is line drawn between several nodes. It can be used to represent a linear feature such as a road.
By placing tags on them (these “name equals value” pairs) this is how we tell the system what this thing is. Tags are the classification system.
We’ll see nodes, ways and tags, and this will become clearer when we take a look at the editor
Slide 12
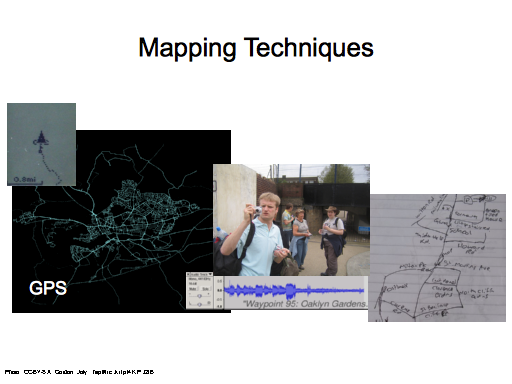
Before using an editor to input data, we need to go out and gather some data. There’s a whole range of mapping techniques.
You can have fun with gadgets. e.g. use a GPS to record a line of dots. This can form a skeleton view of how a road layout looks. You can use camera to record information. Some people even use a dictaphone to speak into.
But it can be as simple as taking notes on a piece of paper.
Photo of me photo mapping by Gordon Joly http://www.flickr.com/photos/loopzilla/2465042085/
Slide 13
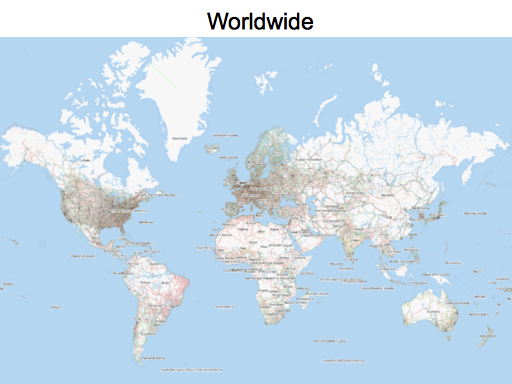
So OpenStreetMap was initially motivated by a desire for open licensed data here in the UK, but we have this editable map platform, and a set of techniques for creating maps from scratch. Obviously this can work anywhere, including the developing world.
This makes it a powerful tool for Humanitarian Work. We can look at creating maps in the developing world, and maps for disaster response.
So let’s look at some examples of humanitarian mapping.
Slide 14
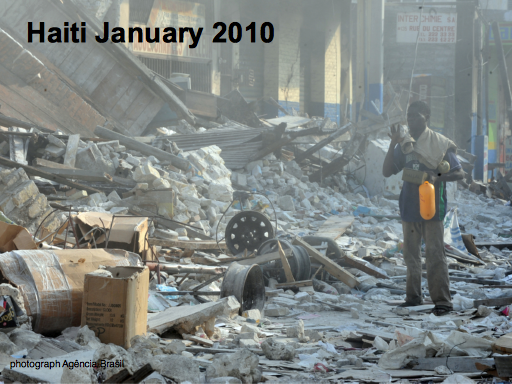
Our best example of disaster response mapping is still the Haiti earthquake of 2010. The earthquake struck and as OpenStreetMappers saw the news…
Photo: Agencia Brasil http://commons.wikimedia.org/wiki/File:Port-au-Prince_20_Jan_2010.jpg
Slide 15
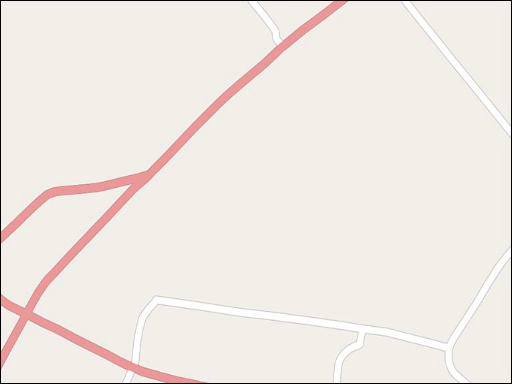
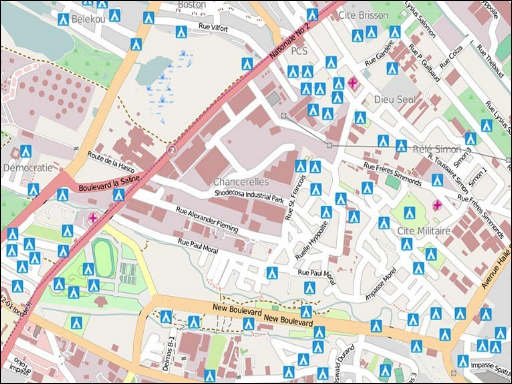
…they saw our maps didn’t have much detail, so they started adding to it, using aerial imagery to trace out a road map.
Slide 16
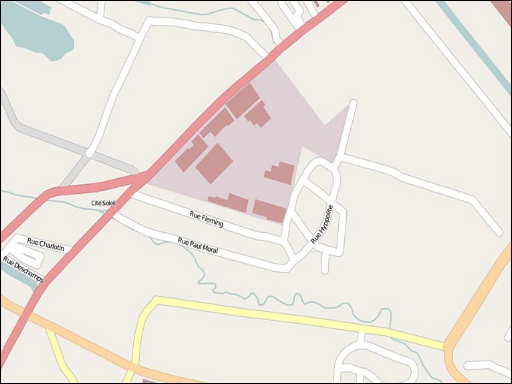
Slide 17
Slide 18
Slide 19
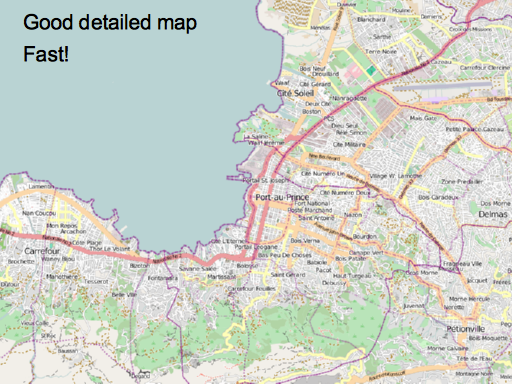
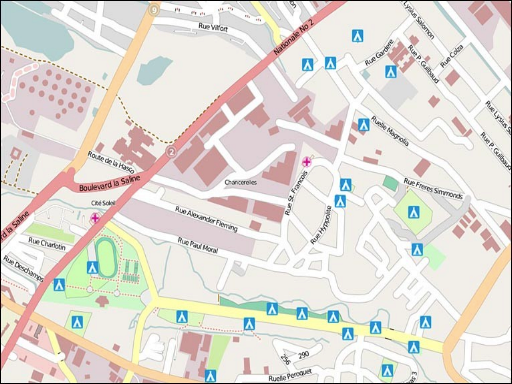
Pretty soon the community came together to produce a good detailed streetmap. This happened quickly! The basic streetmap was in place in about 48 hours.
OpenStreetMap suddenly had the best map available. The only map showing all the city streets. This brought a lot of attention to the project, and people were impressed that this map has sort of spontaneously appeared through collaboration without the need for any special instruction.
Slide 20
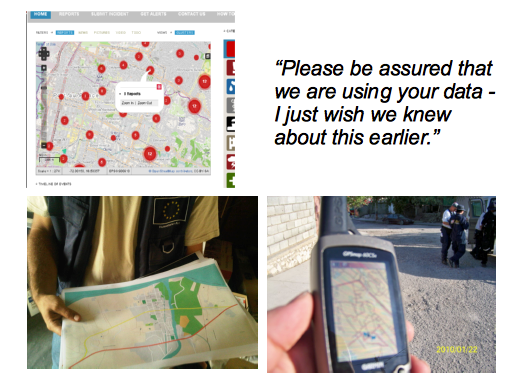
And people used the map.
People used it online as a base map, presenting data on the web. This is “ushahidi” layering data on top.
But more importantly, people were using it in Haiti. OpenStreetMap printouts were going up on the walls in the aid agency control rooms, and handed out to people driving aid delivery trucks.
And here’s a message and a photo from a search and rescue guy. Somebody who worked very directly saving lives by digging people out of the rubble. His teams were loading the vector data onto their garmin device, to use offline.
Slide 21

Since then we’ve responded to other disasters. Here’s Sendai in Japan, after the tsunami there.
Now clearly in a developed country like this there are sure to be good maps available already, but we can create maps which reflect these kinds of situational update. Edits to the map data are shown within minutes.
While superior maps may be available if you know where to look, our maps are openly and easily available. If this can save time for a few disaster responders, then it’s worth doing.
Slide 22
So that was disaster response, but we can also do general mapping in the developing world
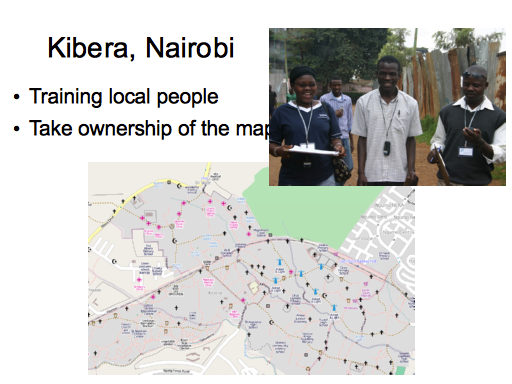
The mapkibera project has been working in the largest slum in Africa, to create a map like this, featuring on-the-ground information such as water points and kerosene fuel stations.
They did this by training local people to contribute to OpenStreetMap, using the simple editing tools. Using OpenStreetMap as a mapping platform, locals could take ownership of their own map. The project involved teaching them to collect data, but also teaching them how to make use of it.
Slide 23
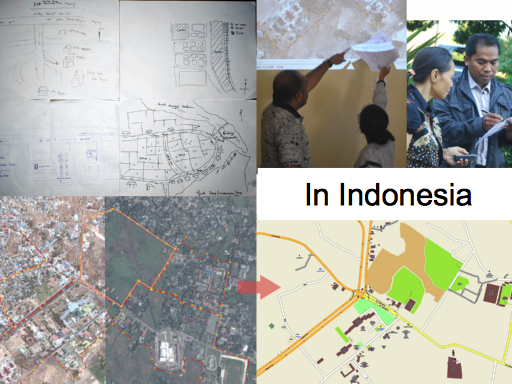
More recently HOT has been active in indonesia with a long running project to map this developing country. This is also about disaster preparedness, mapping out where people live and where people are at risk of tsunamis and earthquakes.
The projects involve teaching locals to map, and setting up a competition between universities to map building details.
Slide 24

I’ve mentioned the Humanitarian OpenStreetMap team (HOT) . This is an organisation within the OpenStreetMap community, brought together to do these things.
In particularly we’d like to engage with aid organisations, organise funding for humanitarian mapping projects and deploy people to run these projects on-the-ground.
Slide 25
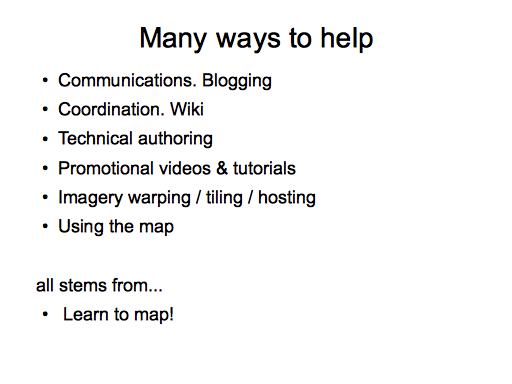
There are many ways to help and get involved with H.O.T. and with the wider OpenStreetMap project. These range from very technical things like software development, GIS skills, geo-rectifying imagery data, through to things like blogging, making promotional videos, and coordinating the community.
But there’s one thing you really need to do first. A “gateway skill”. Lean to map! Learn to contribute to OpenStreetMap using the editor software. We’re going to show you how to do that today. Once you get a feel for that you may well spot other ways you can help.
Slide 26

If we look at how much people contribute to the project and rank people side-by-side with the most active contributors on the left, this graph shows an spike of “elite” mappers on the left, a relatively small group of dedicated contributors, but then a very long tail of thousands of people who contribute a tiny bit. In fact at the tip of the tail we’ve got many registered users who only add one object to the map. The size of this long tail is just as important as the size of the elite spike
But this is interesting today because we’re about to show you how to contribute to OpenStreetMap. If we can show how to add five or six things to the map today, this will actually put you ranking way above most people. You’ll be all the way over here on the left. You can quite quickly consider yourself an expert. You’ll be in a position to help other people learn how to do it.
Slide 27

So let’s do it. Time to learn how to map!
We’ll need to decide which editor to use.
We’ll do some simple remote mapping in Africa just using aerial imagery, and trying out the editors.
Later we’ll head out, get some fresh air, and gather some data with an on-the-ground survey.
Slide 28
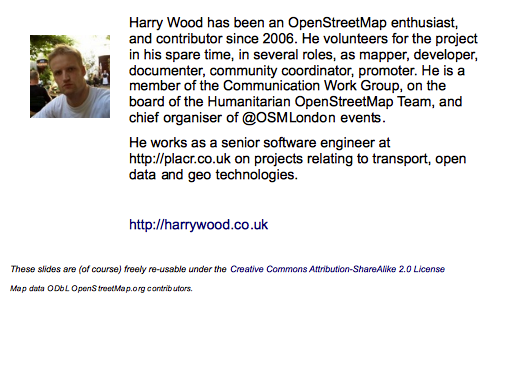
These slides are (of course) freely re-usable under the Creative Commons Attribution-ShareAlike 2.0 License
Map data ODbL OpenStreetMap.org contributors
Jump to slide:
1, 2, 3, 4, 5, 6, 7, 8, 9, 10, 11, 12, 13, 14, 15, 16, 17, 18, 19, 20, 21, 22, 23, 24, 25, 26, 27, 28
I forgot to say… obviously the last slide tails off into vagueness because that’s when we actually started showing people how to use the editor.
If you’re reading through this as a beginner I’d recommend progressing onto the beginners guide to editing on learnosm.org to start learning how to actually edit data. Alternatively the JOSM/Guide wiki pages were mostly written by me (in my usual too-many-words style!)
Great post Harry. I love it. 🙂