Last week I gave a talk about humanitarian mapping with OpenStreetMap. This was at an event organised by Article25, sponge network, and RIBA knowledge communities.
Download slides as an OpenOffice .odp file
Slides on slideshare.net
Or here are the slides as plain old images and slide notes alongside:
I’m going to talk about mapping as in creating maps, and the not-for-profit mass-collaboration project “OpenStreetMap”. I’ll show various examples of how OpenStreetMap has helped in disaster response and developing world situations.
But first let me explain what OpenStreetMap is…
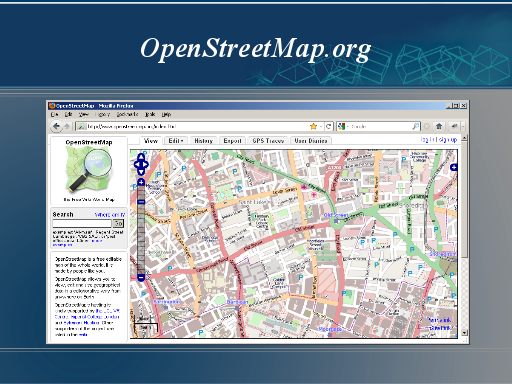
OpenStreetMap.org is a website which displays a map. Here is a map of where we are right now for example. The site lets you zoom in and pan around the map, much like google maps. But you can already see some interesting details which you wouldn’t get with google maps.
OpenStreetMap is much more than just a map…
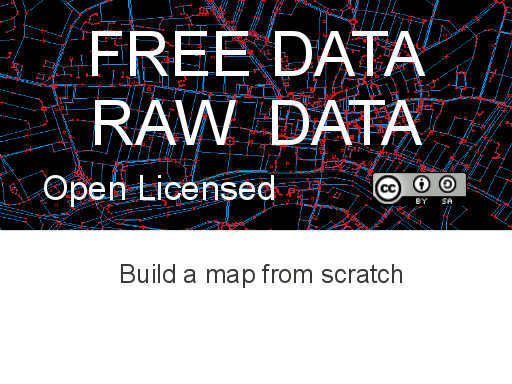
Openstreetmap’s mission is to release map data for free.
This means free as in zero cost
And free as in freedom
Access to the raw data with an open license, means developers have the freedom and flexibility to use map data in new and exciting ways.
This is a rare thing for geo-data. Map data is generally owned by somebody, and raw map data is normally expensive.
So how do we get raw data to release with an open license? We do a crazy thing. We pretend there are no existing maps. We go out and build a new map from scratch.
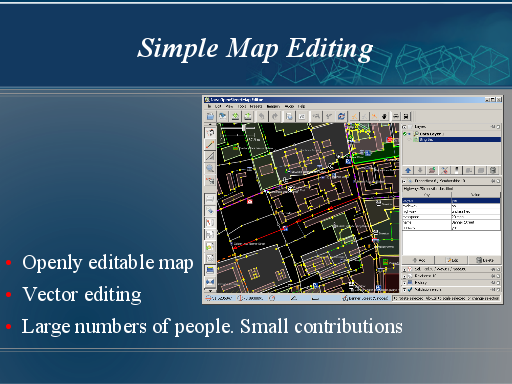
We do this by being openly editable.
The map editing software is designed to be quite simple, although it does involve editing vector data, which is inherently a little bit complex. This editor is JOSM. It looks a but like autoCAD, so hopefully familiar to architects and engineers
But in general we’re trying to keep it very simple because we want to attract large numbers of volunteers to help make the map.
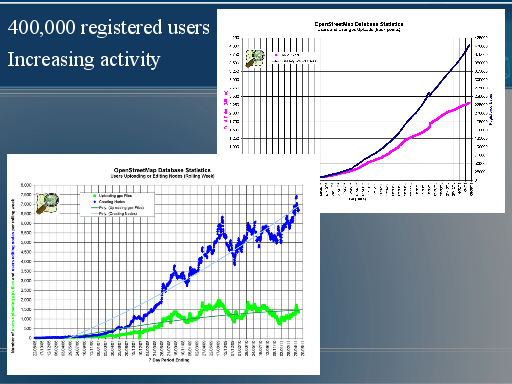
And we’re having some success with attracting contributors. We recently passed 400,000 registered users, and the we’re seeing more and more editing activity all the time.
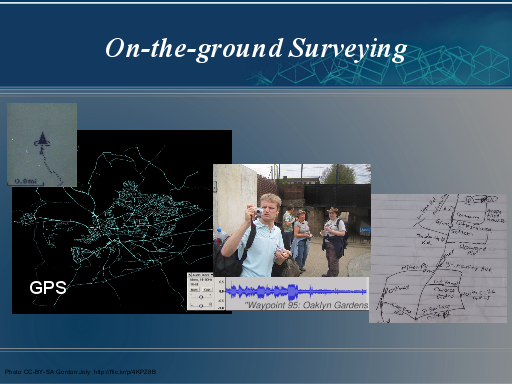
To build maps, we often need to do on-the-ground surveying
This can involve GPS and other gadgets.
…Or a more simple pen and paper approach.
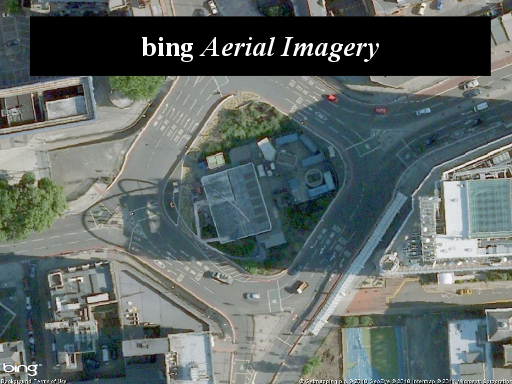
We can trace maps from aerial imagery of course
It’s important to realise though, that companies making maps would normally buy an expensive license from imagery providers, giving them the right to derive vector maps. A lot of money changes hands for something you might imagine to be free.
Generally OpenStreetMap can’t afford licensing costs, but we have agreements with Yahoo! and more recently Bing imagery which covers some parts of the world. Here in London it has excellent resolution.
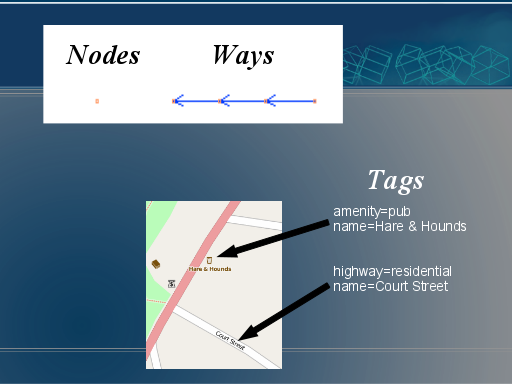
Like the editing software, the underlying Data model is kept very simple.
The map is composed of nodes and ways. And these elements have tags attached to them, to describe what real world feature we are representing.
This low level vector data is rendered into a maps with various style choices. This flexibility is rather like the having many layers of vector data in autocad, and select the layers and styles to print out.
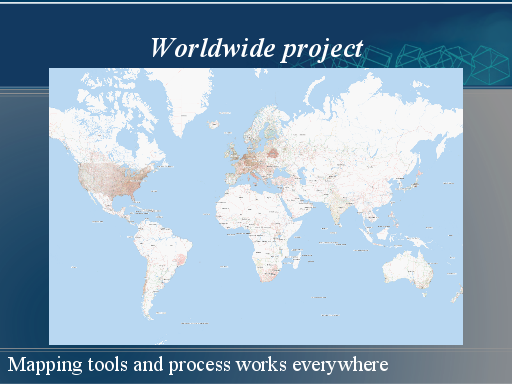
So OpenStreetMap is not particularly a humanitarian project. It originated with this open data purpose in mind for developed countries (it originated here in London in fact)
But we have this simple map making framework in place, and the map is editable worldwide. All of the same mapping techniques can be applied anywhere in the world. This makes it a mapping platform with huge potential for developing countries, and for aid agencies operating there.
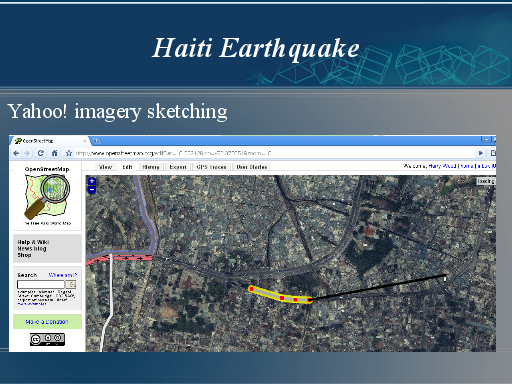
When the earthquake struck in Haiti a few people people in the community very quickly went and looked to see if there were improvements to be made to OpenStreetMap there.
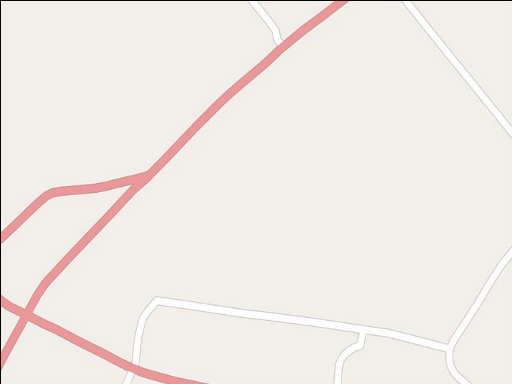
The stricken cities of Port-au-Prince and Carrefour have yahoo imagery coverage. So straight away a handful of people set to work tracing in roads to create a street map. As you can see, this imagery is a bit fuzzy, but good enough to see the streets.
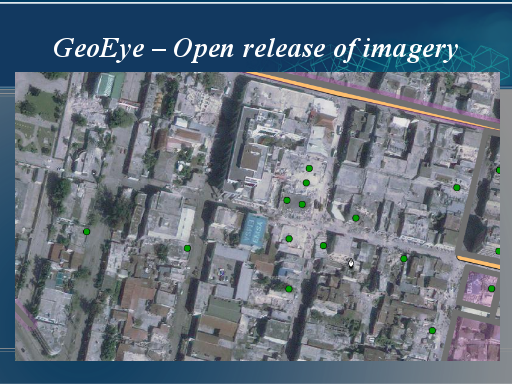
Because of the severity of the disaster and the international attention it received, aerial imagery providers GeoEye released an area of imagery for free.
This was post-quake imagery so you can see some collapsed buildings, and people camping out in the streets.
More people started getting involved in tracing the imagery. We also found old military maps which we could use as a source of some street names.
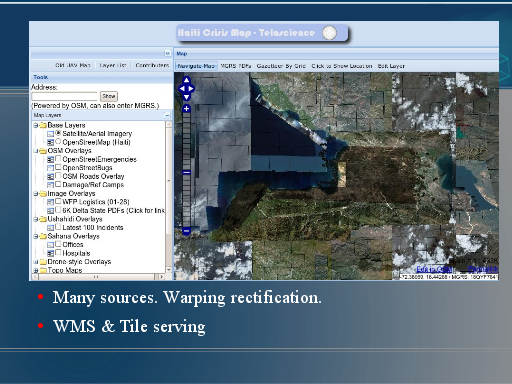
There’s some clever technical people in the OpenStreetMap community. They were able to marshal the large imagery datasets into tiles which could appear within the openstreetmap editors.
Other imagery sources became available with varying resolution and updated-ness. This shows a patchwork of different sources brought together in one place, and set up as tiles which can be brought into the OpenStreetMap editors.
So the community mapping by remote was able to go from this…
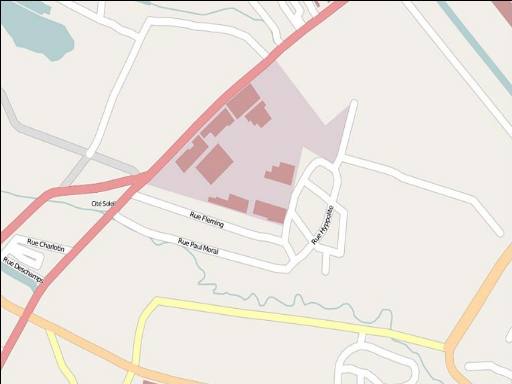
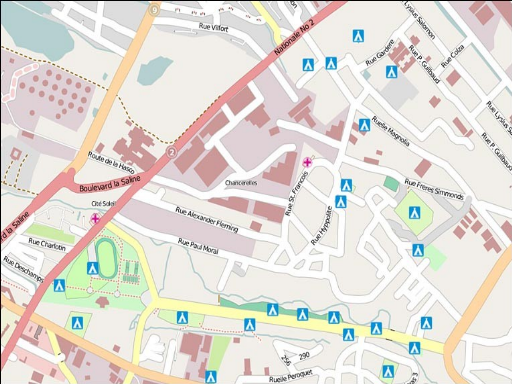
…to this
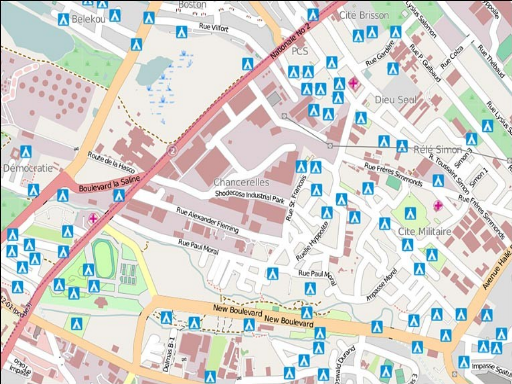
The campsites here are the positions where people were visbly camping out in the streets.
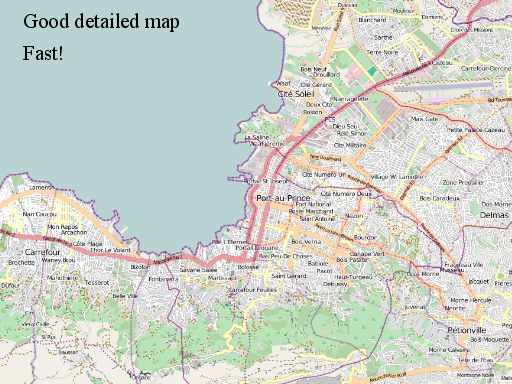
So we produced a good detailed streetmap of these cities, and we did it quite quickly.
This is the map as it appears now on OpenStreetMap, but we had created the important street map in place within 48 hours.
This was appearing very publicly in a useful display on OpenStreetMap.org
But let’s look beyond displaying the map on our website…
With OpenStreetMap you can do the classic google maps style mash-up thing, so embedding a map on your website with OpenStreetMap as a layer and push-pins or other information on top.
People launched all sorts of other initiatives around the web to help with disaster management, some more successful than others. A lot of them used maps to try to track things happening on-the-ground in Haiti.
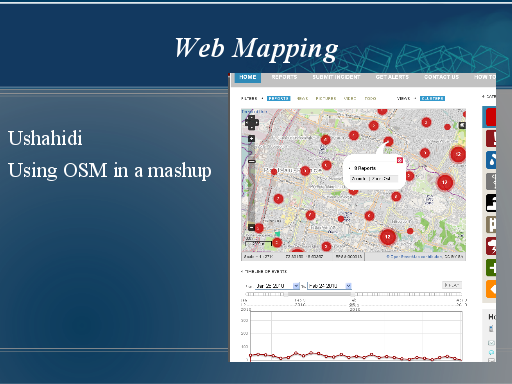
This site is called “ushahidi”. It does aggregating and tracking of reports coming in on various communication channels, all plotted on a timeline, and on a map. So they’ve followed this mashup approach, and switched from using google maps to OpenStreetMap as the background map.
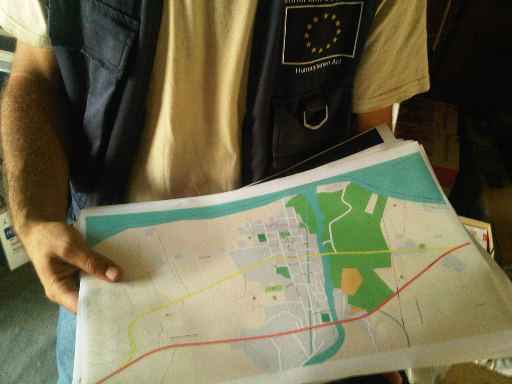
But more exciting than that, aid agencies on the ground were finding out about OpenStreetMap
In fact we had by far the best map, of these cities. Printouts of OpenStreetMap were pinned up in the control rooms and tents of aid organisations.
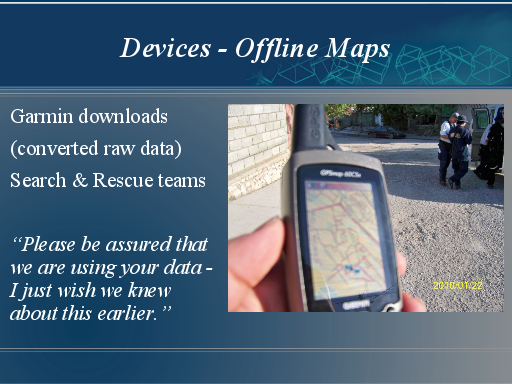
OpenStreetMap offers raw data downloads and also downloads of formats converted to work on various devices.
Garmin downloads are particularly popular, and search and rescue workers found our garmin downloads useful. Allowing them to find their way through the chaos without needing to be online.
In fact we received an impassioned message of thanks. That was was very gratifying for everyone involved. That’s when we knew we had made a difference.
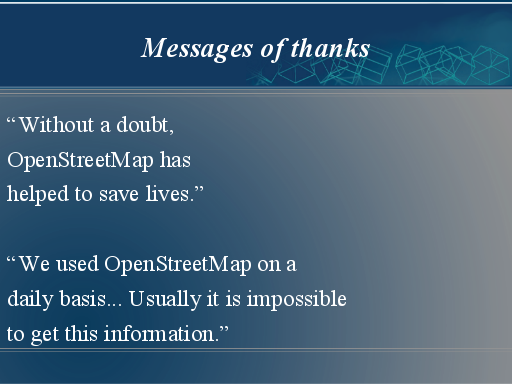
Here are some other quotes
One from a MapAction coordinator. One from UNOSAT technical staff
So that is the story of how OpenStreetMap helped with the Haiti earthquake response
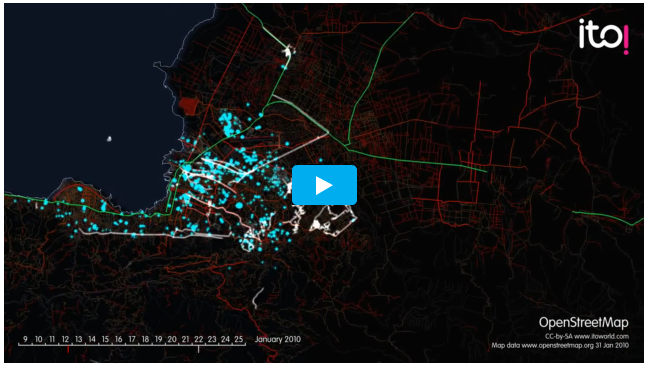
Watch ITOworld haiti OpenStreetMap animation video
This video shows a white flash for every edit taking place on the map data. Each one represents some work, perhaps 10 minutes, perhaps a hour, by an individual contributor.
You can sit back get a sense for all this mapping work going on, and the buzz and activity of the community as they pounce on the aerial imagery and respond to the disaster. The blue glowing bits are campsites
So that was a disaster mapping situation. OpenStreetMap is also of interest to aid organisations working on more long term development goals.
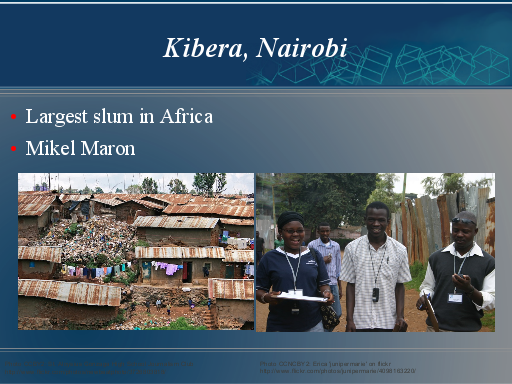
A guy called Mikel Maron spearheaded a lot of the humanitarian work with OpenStreetMap. He spent a long time out in Nairobi Kenya, and went to the largest slum in Africa, a place called Kibera.
He received some funding from aid organisations to do this as a project called MapKibera (MapKibera.org). They used OpenStreetMap to make a map of the slum including water supply fountains, and medical facilities.
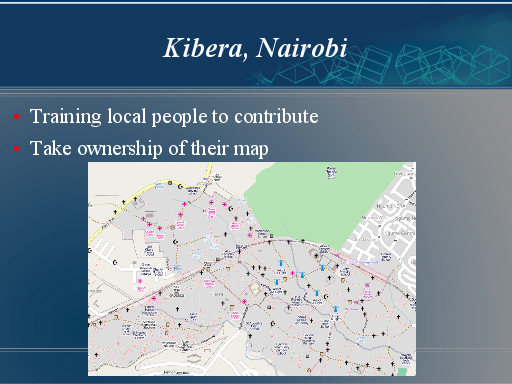
So they managed to create this map, but they did it by training local people to contribute to OpenStreetMap, using the simple editing tools. Using OpenStreetMap as a mapping platform, locals could take ownership of their own map. The project involved teaching them to collect data, but also teaching them how to make use of it.
Official maps of nairobi didn’t acknowledge the existence of Kibera. This new map gives them the knowledge and the power to enter into informed discussions with the authorities about their plans for bulldozing areas of the slums.
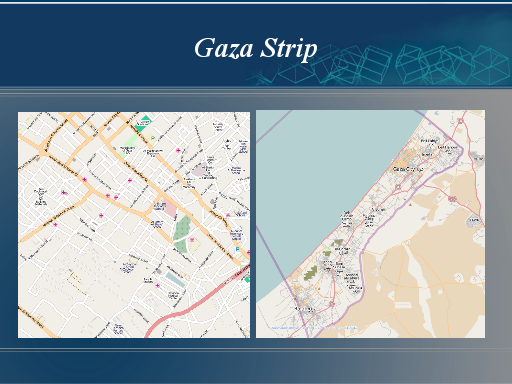
There was a project to map the gaza strip, again engaging with the local community. On this early project the OSM community held a fund-raiser to buy an area of aerial imagery from a satellite company.
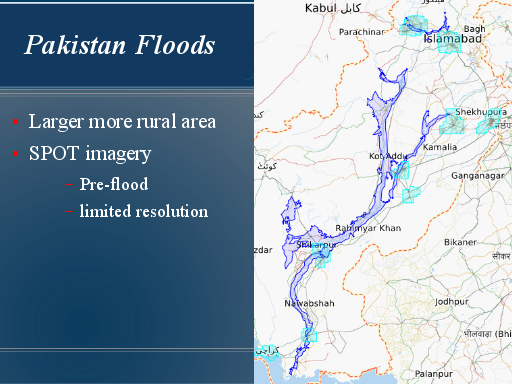
We thought the Pakistan floods would be the next big example of the power of OpenStreetMap to make a difference in disaster response, but in comparison with Haiti, the disaster struck area was collosal. Floods spread up and down the length of Pakistan.
The dark blue area is imagery specially provided to us by SPOT. Quite a large area, but fairly limited resolution, so this limited what we could achieve during the flooding.
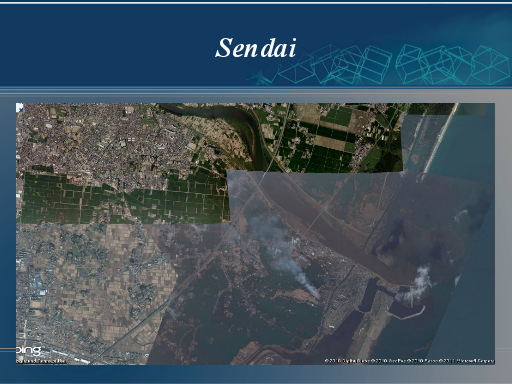
Similarly there was quite wide scale descruction all along the coast in Honshu part of northern Japan when the tsunami struck.
We were able to see some good imagery in Sendai for example. Bing merged in some useful imagery into their standard offering. You can see some patches here are showing post disaster destruction and flooded areas on the sea front.
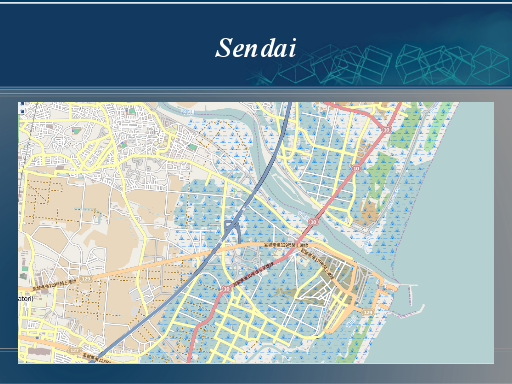
Now clearly in a developed country like this there are sure to be good maps available already, but we can create maps which reflect these kinds of situational update. Edits to the map data are shown within minutes.
While superior maps may be available if you know where to look, our maps are openly and easily available. If this can save time for a few disaster responders, then it’s worth doing.
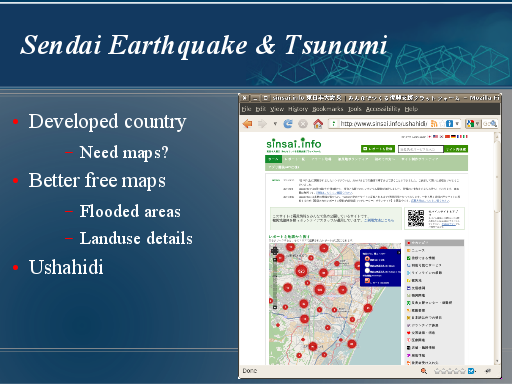
And this map is available to embed in other websites which may be providing services to aid in disaster response. Here (on sinsai.info) we see the “ushahidi” system deployed again to allow temporary situational reports, and requests for help coming in various communications channels. With a better basemap, this data can layered on top in a clearer and more acurate way
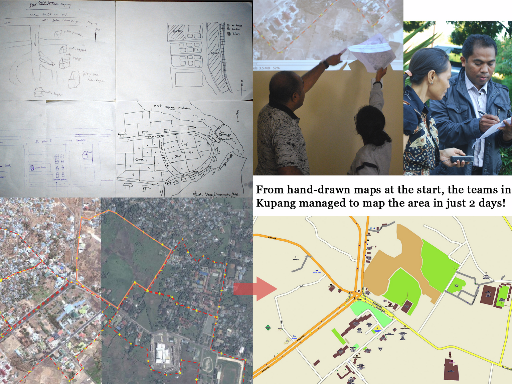
This summer a team have travelled around Indonesia running a series of workshops to get local people involved in detailed mapping. This has been the latest HOT project, just coming to an end. It’s the first time we’ve looked at doing a targetted disaster mitigation exercise, aiming to better map an area identified as at risk of seismic activity. This project has also seen a focus on building mapping, with a competition between univerisites to make a game of the process of adding buildings in.
(For more on this see ‘indonesia’ category on the hot blog)
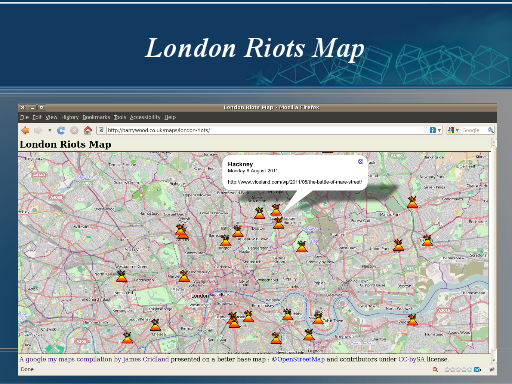
This is a new slide. I’m not sure if it really belongs in a slide deck about humanitarian mapping. When you think that 300,000 died in the Haiti disaster, London isn’t really facing a “disaster” right now, no matter how much the media builds it up.
Even so, there is an interesting need to filter and tame the information overload. Maps privide a way of doing this. Here we see a validated list of riot incidents layed out on a map.
And of course it’s our map. Me and my friends have walked these streets to create a detailed map. It’s always gratifying to have it used (and frustrating when people use boring old google maps)
Perhaps we’ll aim to add some new contruction areas after the riots …and remove a few shops.
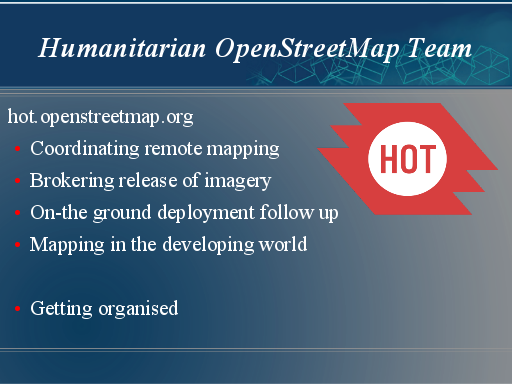
After haiti we formed a new organisation: the Humanitarian OpenStreetMap team (HOT) . This is an attempt rally some the openstreetmap community around the humanitarian mapping cause, and to put a more organised face on the community, which can seem chaotic and anarchistic for outsiders.
In particular we’d like to engage with aid organisations and get more funding, and deploy people to do humanitarian mapping on-the-ground.
So that’s OpenStreetMap.org and the Humanitarian OpenStreetMap Team.
You can find out more at these sites (openstreetmap.org, hot.openstreetmap.org) You can donate to OpenStreetMap directly. We’ve also got some fund raising more direcly related to hot on the hot site, but I hope you’ll also be inspired to learn how the OpenStreetMap editors work, and have a go at contributing to some mapping.
These slides are (of course) freely re-usable under the Creative Commons Attribution-ShareAlike 2.0 License
Credit to Schuyler Erle and David Dean for some slide images and slide inspiration
Map images are CC-BY-SA OpenStreetMap
One thought on “Humanitarian OpenStreetMap Team talk for Article25”