Last week I gave a talk at #geomob, London’s second most important geo meet-up group (after OSMLondon of course). It was good to be able to get up and present something after watching so many others over the past couple of years.
My talk was about the Humanitarian OpenStreetMap Team (hot.openstreetmap.org) I’ve been doing a fair bit of HOT stuff lately, so it came at a good time. I’ve just got back from a week long trip to Washington D.C. for a board strategy meeting, followed by various events there. The talk is a refresh and update of previous talks I’ve given on the topic, plus some new info inspired by this recent trip (newer stuff from slide 18 onwards)
Download slides for OpenOffice (28Mb!)
…or just see them below with notes (kind of a transcript) alongside:
Slide 1
I’m going to talk about the Humanitarian OpenStreetMap Team. How OpenStreetMap offers a great platform for humanitarian mapping, and a look at some of the achievements and challenges of the H.O.T. organisation
Slide 2
I guess everyone knows OpenStreetMap, so I won’t do the full intro, but let’s just recap some of the key characteristics of this project.
Slide 3
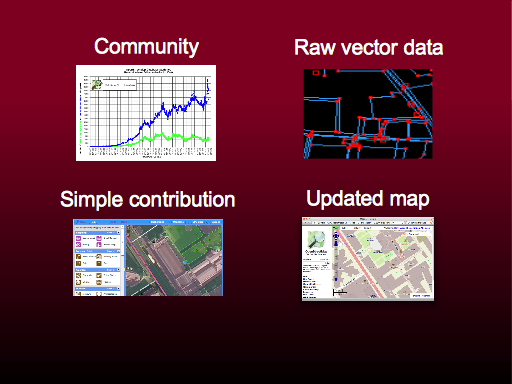
These are also things which make OpenStreetMap valuable as a platform for humanitarian mapping.
OpenStreetMap is a massive community. An army of volunteers doing mass collaboration using simple map editing tools and simple data gathering techniques
Fundamentally OpenStreetMap is about providing free raw map data in vector form, but we do have a map display which is updated within minutes, showing changes made to the map, and this can be important for humanitarian uses.
Slide 4
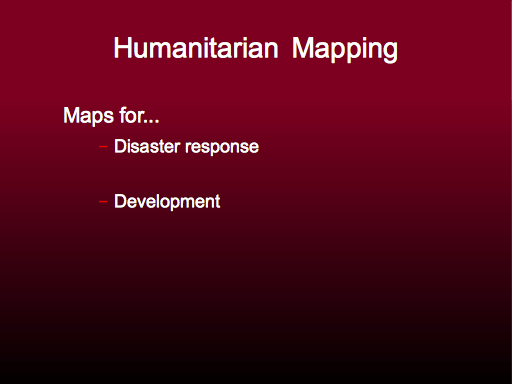
There’s two different aspects to humanitarian mapping. Disaster response; maps to help agencies respond to earthquakes, floods, hurricanes, also things like famine and human conflict.
Then there’s maps to help in with economic development. Lifting people out of poverty.
Slide 5
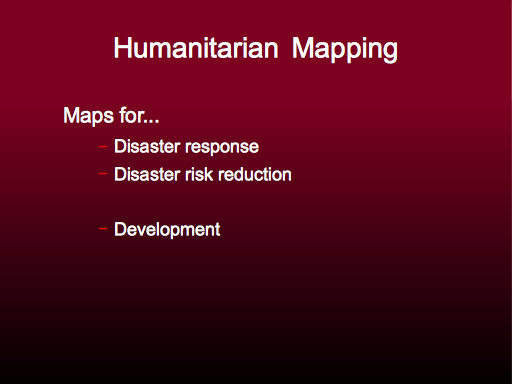
We can sneak in another category related to disasters. Disaster risk reduction. Finding ways to make disasters less disastrous.
Slide 6
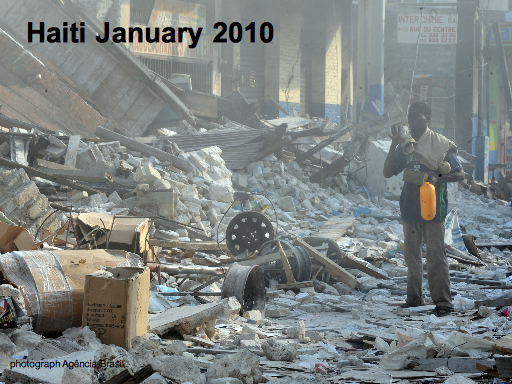
Photo: Agencia Brasil on wikimedia commons
Disaster response is the most attention grabbing category. Haiti is still the best example of this.
There was a terrible earthquake in January 2010.
Slide 7
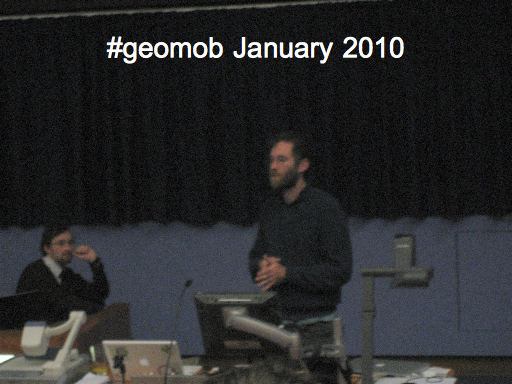
In January 2010 we also had a geomob! This was a couple of weeks later, and here’s a Mikel talking about a rather interesting thing which happened in the OpenStreetMap community
Slide 8
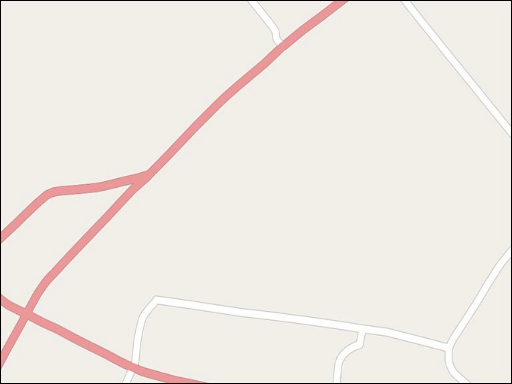
They made a map. Using the normal openstreetmap processes, and coming together to collaborate.
Slide 9
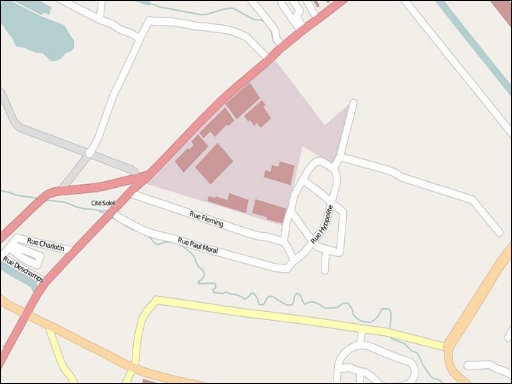
Slide 10
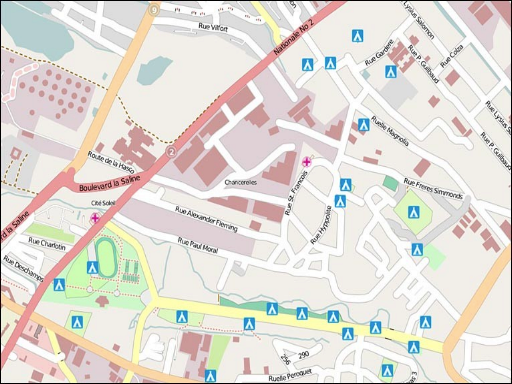
Slide 11
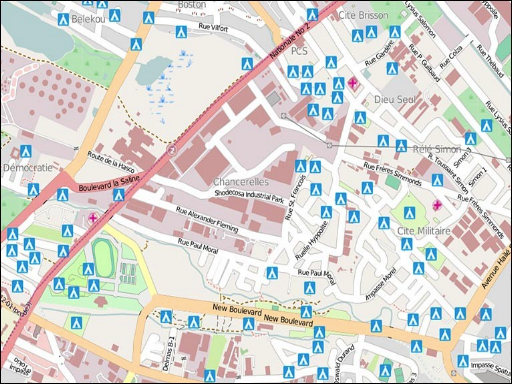
Slide 12
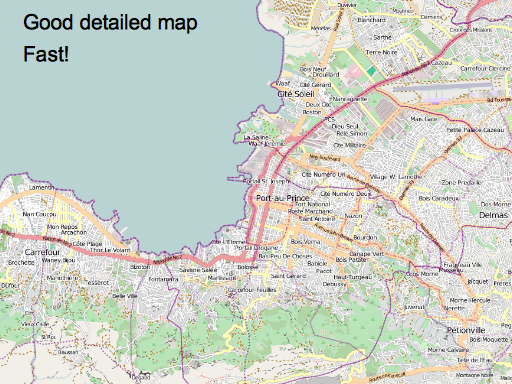
A good detailed streetmap, and they made it quickly! The basic streetmap was in place in about 48 hours.
OpenStreetMap suddenly had the best map available. The only map showing all the city streets. This brought a lot of attention to the project, and people were impressed that this map has sort of spontaneously appeared through collaboration without the need for any special instruction.
Slide 13
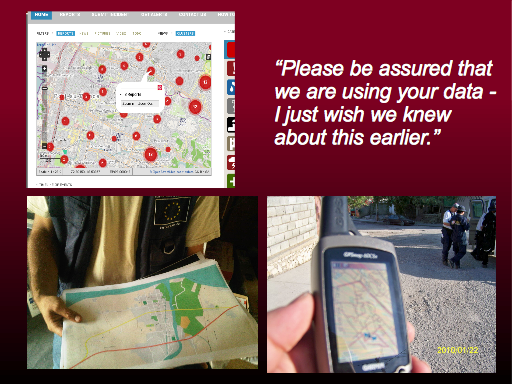
And people used the map.
People used it as a base map, doing the web map “mash-up” thing. This is “ushahidi” layering data on top.
But more importantly, people were using it in Haiti. OpenStreetMap printouts were going up on the walls in the aid agency control rooms, and handed out to people driving aid delivery trucks.
And here’s a message and a photo from a search and rescue guy. Somebody who worked very directly saving lives by digging people out of the rubble. His teams were loading the vector data onto their garmin device, to use offline.
Seeing a message like this, we realise this isn’t just hippy nonsense. We really can save lives with maps!
…So that’s disaster response.
Slide 14
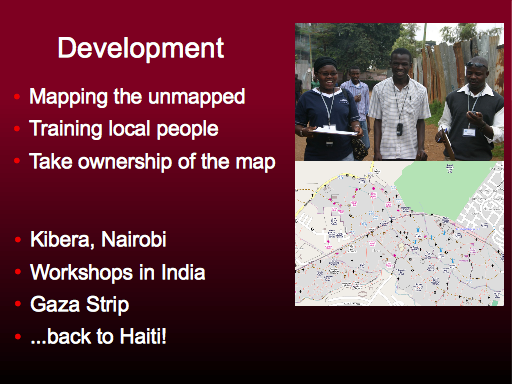
Mapping for development is partly just about mapping the unmapped parts of the world, bringing open data to shine a light on these places. That’s pretty much what the wider OpenStreetMap project will do. With HOT we can focus on developing countries. We’re not just talking about helping aid agencies delivering of aid. Free maps can spur all kinds of economic development.
But there’s another interesting aspect of this. Because the tools are simple, we can go there and train local people to contribute to the map and use the map. That’s a better way of getting and maintaining detailed map data, but it also means communities take ownership of their map.
There’s been various projects along these lines. Kibera, India, Gaza, and…
Slide 15
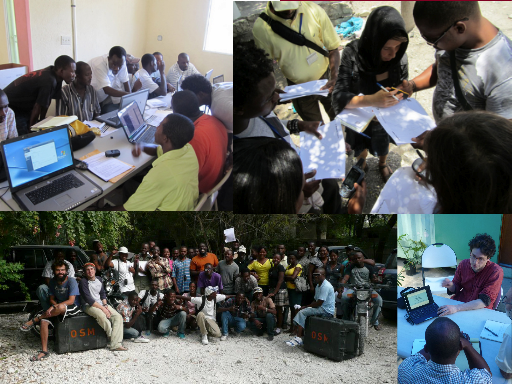
Photos from Haiti are on the HOT facebook page
Ever since the earthquake we’ve also been doing these things in haiti.
Aid agencies are still operating there, and there’s funded projects to keep OpenStreetMap involved and build a capacity for mapping among the Haitian people.
It’s looking like we’ll be doing similar work in Senegal this year.
Slide 16
Earthquake map on wikimedia commons
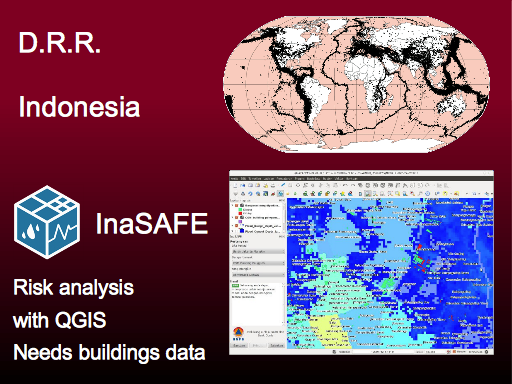
So what about disaster risk reduction? You can’t predict where the next disaster will happen, but actually we can look at seismic hotspots and vulnerable population centres. Where are disasters likely to happen? One answer is Indonesia.
That’s something Indonesian government are aware of, as are many aid organisations, and so there are many DRR projects and initiatives here.
We’re working with some people who developed a plugin to QGIS which will do risk analysis, but they need map data. Specifically they need data on where buildings are.
Slide 17
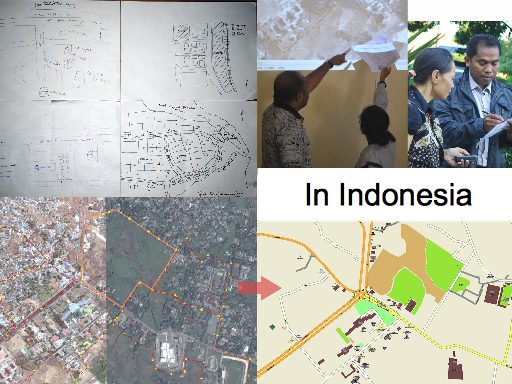
Kate Chapman has spent time in Indonesia on and off for the past year or so. We have funded projects there. These involve doing the training thing again, teaching locals to map, also going into universities and setting up a competition to map buildings.
Slide 18
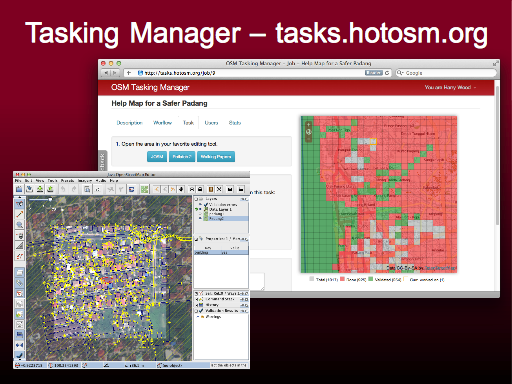
And here’s an interesting thing which came out of this work in Indonesia. The “Tasking Manager” at http://tasks.hotosm.org . This was paid software development (unusually for OSM), as part of this initiative to map lots of buildings in Indonesia, but the developer likes the project so much he continues to work on it after we’ve stopped paying him.
So what’s the idea of this thing? You may be able to guess just from looking at it. Mappers can go here and pick a square to work on. The chosen square launches into your editor software, you map all the building outlines, and then you label the task as done.
A very common problem new users have is that, on top of the learning curve of the editing software itself, they also need to figure out what kind of data they should be adding and where exactly to zoom in on the map to add it. The tasking manager spoon feeds them with a job to do and clear instructions. It’s a way of directing the community, and helping new users.
Slide 19
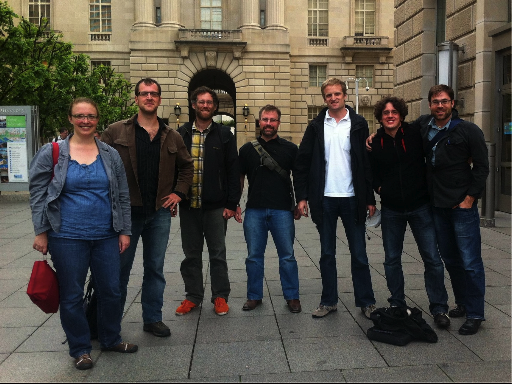
Here’s me and the H.O.T. board in Washington D.C. last week. We got funding to get together and hold a meeting to discuss the strategy and direction of the organisation. A two-day long meeting to thrash out strategic ideas.
Slide 20
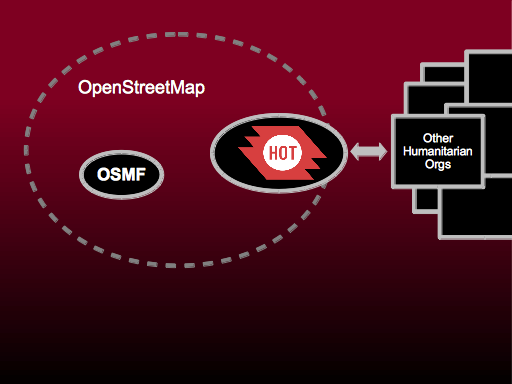
H.O.T.’s positioning as an organisation is quite interesting.
OpenStreetMap is this big community of volunteers who can come and go in quite an ad-hoc fashion with many different motivations. Its a confusing thing for outside organisations to try to interact with. So an important role of HOT is to act as an interface to governments and aid organisations, helping them use OpenStreetMap, and presenting a more legitimate organised face which is very important for attracting funding for example.
But the power of HOT is the power of OpenStreetMap. We’re built on the same volunteerism. This presents difficult questions. For example if we hire paid staff, does that put off the volunteers? How can we make sure people feel involved and assign roles and responsibilities?
Actually all these are questions facing the OpenStreetMap Foundation, a not-for-profit organisation at the core of OpenStreetMap, managing the servers and funding of the project. There’s a great deal of political pressure, and a lot of eyes on the OSMF as they try to decide when to take on issues of project governance, and how to interact with the community. The chosen path for them a lot of the time, is to play only a minor supporting role, devolving as much as possible to the community of volunteers, limiting mission creep, and remaining lean as an organisation.
For HOT there’s less of this pressure, and most people are happy to see the organisation grow, in order to better respond to humanitarian challenges, e.g. hiring people, and spending money on flights etc for people to do humanitarian projects.
To help with this, we’re appointing an executive director (and making sure she is properly paid) (announcement). This also helps with this thing of interfacing with aid organisations and attracting funding. They will expect HOT to be arranged as a more classical organisation.
OpenStreetMap feels chaotic sometimes. But it’s interesting to reflect that actually on the right hand side of this diagram, all of these well-organised charities etc in the humanitarian sector all add up to a bewildering landscape. Everyone’s partnering, collaborating, or often viscously competing. They all have acronyms for names. Funding flows in all directions. It’s a different kind of chaos. In between that and the chaos of OpenStreetMap lies H.O.T. It’s an interesting place to be!
Slide 21
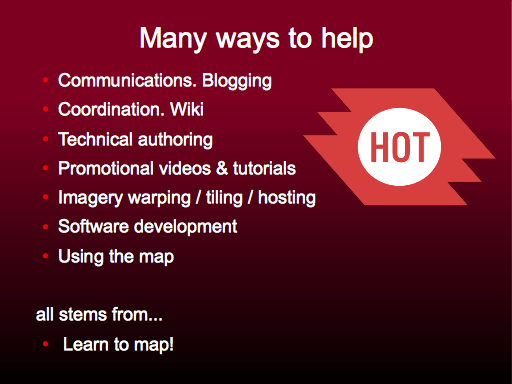
I’ll wrap up by mentioning some ways anyone can help and get involved with H.O.T. As with the wider OpenStreetMap project, there’s many ways to help, and these range from very technical things like software development, GIS skills, geo-rectifying imagery data, through to things like blogging, making promotional videos, and coordinating the community.
But there’s one thing you really need to do first. A “gateway skill” : Learn to map! Learn to contribute to OpenStreetMap using the editor software. It’s supposed to be simple, and by learning this you’ll get a much better idea of how OpenStreetMap comes together. You’ll probably get a bit addicted, and you’ll clearly see the other ways you can help.
Also if you’re attending geomob and you haven’t tried editing OpenStreetMap…. shame on you! You must try it!
Slide 22
Thankyou very much! Check out the Humanitarian OpenStreetMap Team at http://hot.openstreetmap.org
Slide 23
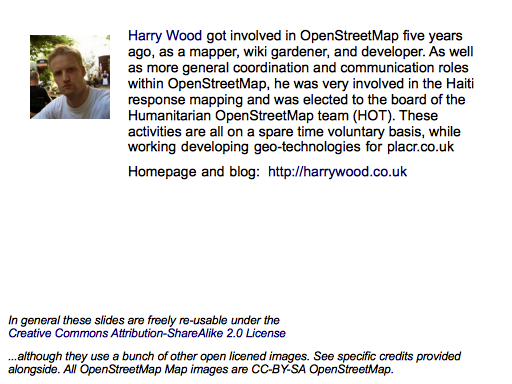
In general these slides are freely re-usable under the Creative Commons Attribution-ShareAlike 2.0 License
…although they use a bunch of other open licensed images. See specific credits provided alongside. All OpenStreetMap Map images are CC-BY-SA2 OpenStreetMap.
Jump to slide:
1, 2, 3, 4, 5, 6, 7, 8, 9, 10, 11, 12, 13, 14, 15, 16, 17, 18, 19, 20, 21, 22, 23
One thought on “#geomob presentation on HOT”