For my presentation at the OpenStreetMap conference State Of The Map 2014 in Buenos Aires, I gave a talk titled “The Long Tail of OpenStreetMap”.

Video of my ‘Long Tail of OpenStreetMap talk’ now available!
Below are all the slides and transcript of what I intended to say in the talk.
Download slides as LibreOffice Impress .odp file (9MB)
Jump to slide:
1, 2, 3, 4, 5, 6, 7, 8, 9, 10, 11, 12, 13, 14, 15, 16, 17, 18, 19, 20, 21, 22, 23, 24, 25, 26, 27, 28, 29, 30, 31, 32, 33, 34, 35, 36, 37, 38, 39, 40, 41
Slide 1
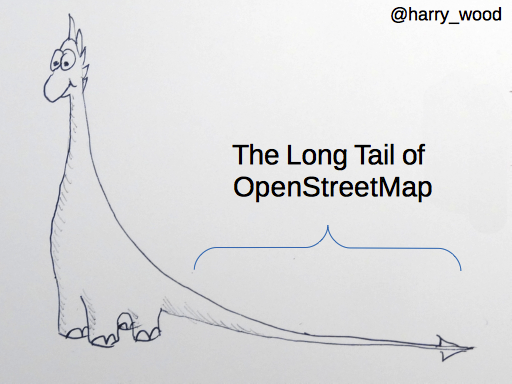
The “Long Tail Of OpenStreetMap” is something I found myself talking about a lot, in conversations about OpenStreetMap. I think it explains a lot about the shape of our community, so I thought I would dedicate a talk to it.
But I also realise that while I keep referring to the ”long tail”, maybe it’s not clear what I mean.
Slide 2
I was vaguely aware of a best-selling book called the “the long tail”. Turns out this has got nothing to do with it! “Why the future of business is selling less of more” It’s a book about how new online retailers like amazon have a very wide product range. It’s probably quite interesting by not what I’m thinking about
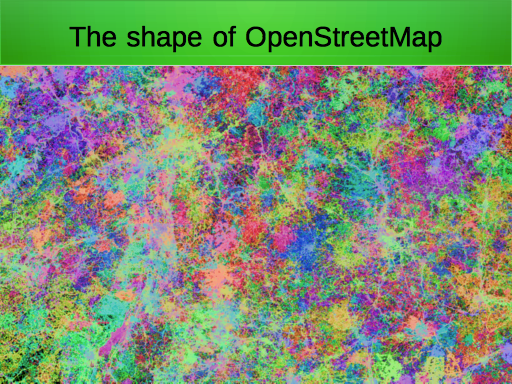
Slide 3
http://bl.ocks.org/lxbarth/raw/6545162/#8/49.513/9.539
I’m thinking about the “shape” of the OpenStreetMap community. Does anyone recognise this? It’s a map rendering by Eric Fischer, with different colours for different OpenStreetMap users. (I’ve zoomed in on part of Germany)
So the shape of the OpenStreetMap community is… I guess you could say it’s “blotchy”, but it’s this wonderful patchwork of contributions from different people
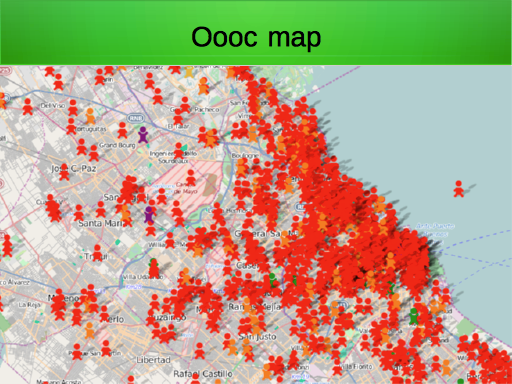
Slide 4
http://resultmaps.neis-one.org/oooc?zoom=12&lat=-34.57428&lon=-58.47726&layers=B00TFFFFFT
And here’s the “Overview Of OpenStreetMap Contributors” map by Pascal Neis showing the centre of activity of the map editors. Lots of people editing here in Buenos aires!
So again this gives a feel for the shape of our community and the many people who build the map. I think maybe we should put maps like these as part of the OpenStreetMap.org front page.
Slide 5
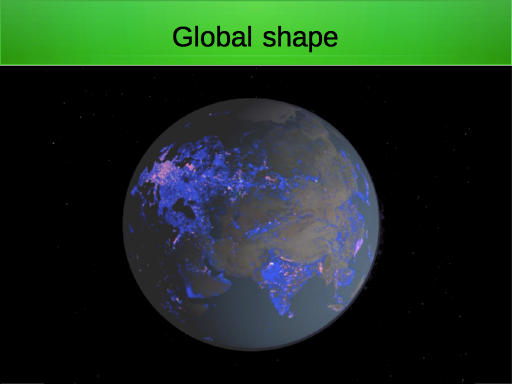
Frame from the video: https://vimeo.com/56374742
CC-BY-SA-3.0 Derick Rethans
Our community is a global shape of course, but fizzing with activity concentrated in places like Western Europe.
So we’re globe shaped but…
Slide 6
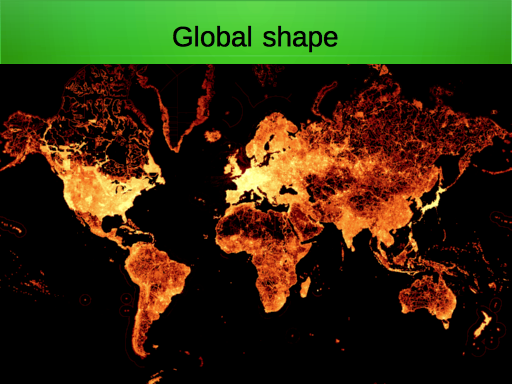
CC-BY-SA3.0 Martin Raifer – https://github.com/tyrasd/osm-node-density
…not evenly distributed throughout the globe.
There will always be lots more activity in some parts of the world than others, but actually in terms of geographic diversity, I don’t think we do too badly. There’s a great lively community here in South America for example.
But what if we ignore maps for a moment (Might sound like a strange thing to say) but what is the shape of the OpenStreetmap community when we’re not putting it on a map?
Slide 7
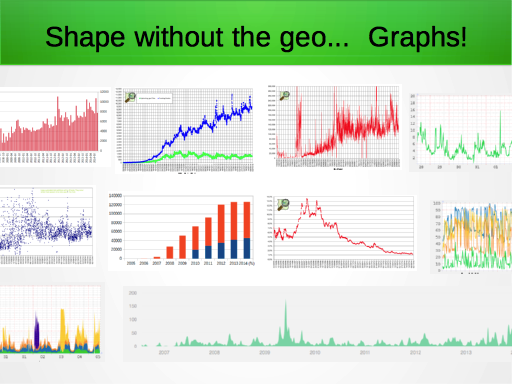
Well there’s graph shapes of course. These are a bunch of graphs you can reach off the wiki “Stats” page.
We love our graphs!
Slide 8
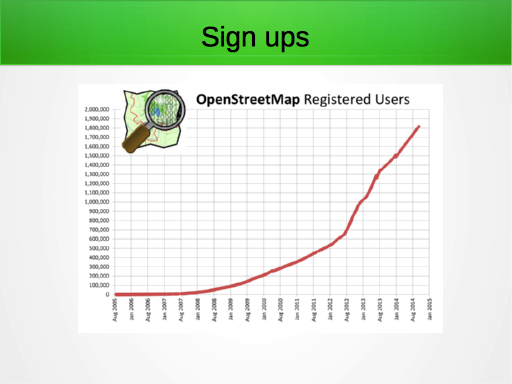
Here’s our favourite graph of course: The number of signed-up users, curving upwards nicely over the years.
Will we reach 2 million users by the end of the 2014?!
Slide 9
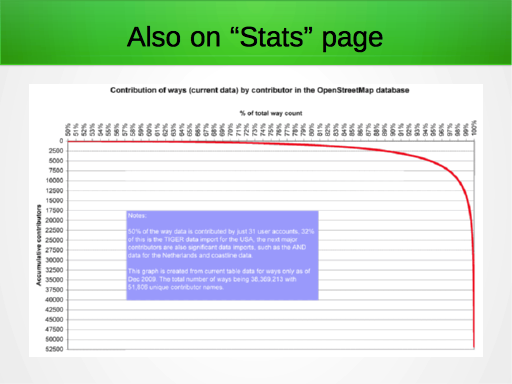
Further down at the bottom of the wiki ‘stats’ page is this curious graph.
This is it! This is the “long tail of OpenStreetMap”
Slide 10
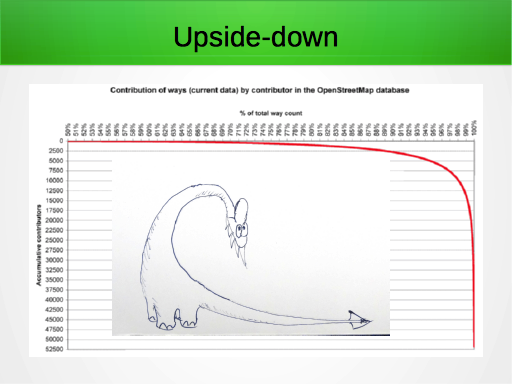
Except to me it feels like it’s upside-down. There’s something a bit difficult to read about it.
So I will redraw it…
Slide 11
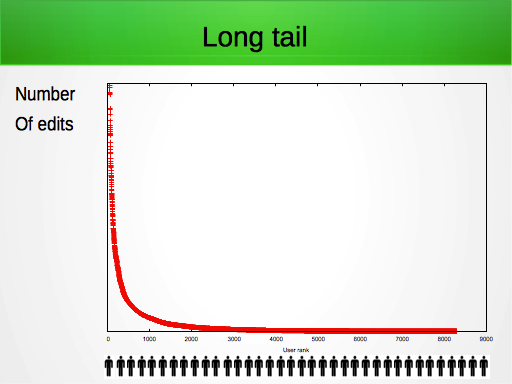
…the way I like to think of it. Here is the “long tail”
So let me explain this. We take all the users and get them to stand side-by-side on the x axis here, ranking them by the number edits they have made. So on the far left are the people who made the most edits.
The ‘y’ axis is the number edits, and this is the shape of the graph you get.
Slide 12
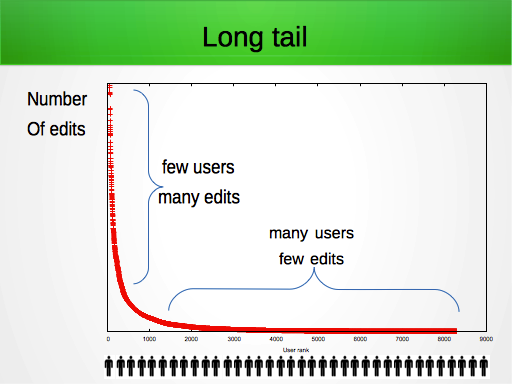
So what were seeing basically is a few users making many edits (This spike on the left) and then many users all chipping in a little bit, making just a few edits, forming the “long tail” along the bottom.
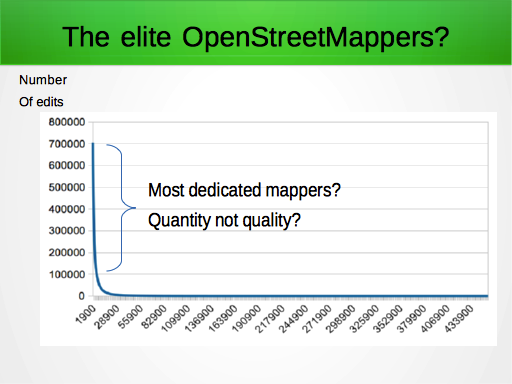
Slide 13
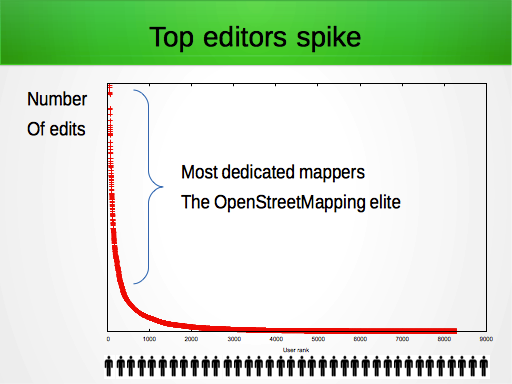
So perhaps we can say that on the left here we have the most dedicated mappers. The OpenStreetMapping elite.
But I just know many of you are already thinking this is not right because…
Slide 14
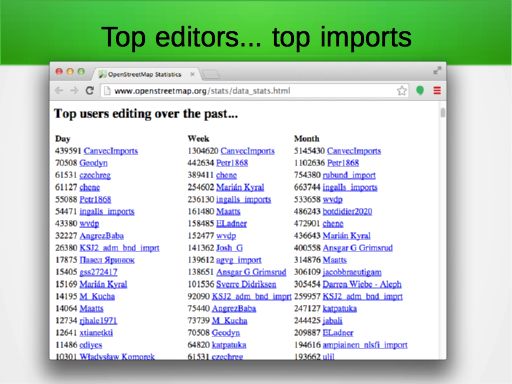
What about imports?
The users making the most edits are people doing imports, or other forms of automated editing. The rankings on this stats page show lots of “import” users at the top.
While these are perhaps good contributions to OpenStreetMap. It’s not really the idea to elevate these people to the elite. The “most dedicated” contributors.
Slide 15
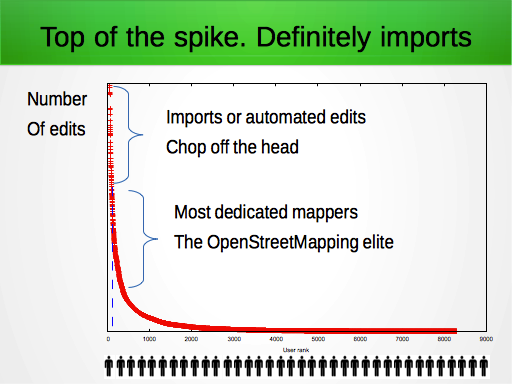
So well maybe we can say that the top of this spike are imports, and then somewhere further down the curve are the most dedicated mappers
Maybe we can improve our graph by chopping off the head.
Of course this is a pretty blunt instrument. We have to choose an arbitrary cut off point and…
Slide 16
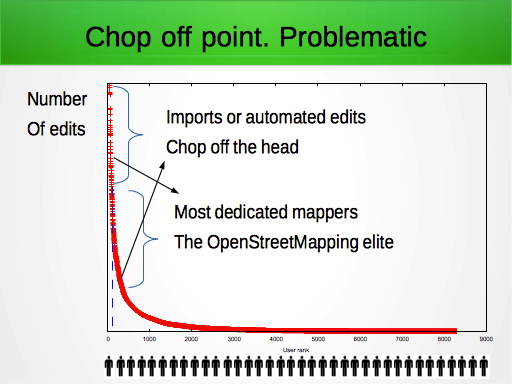
…depending on how many users we chop off, some of them may be perfectly valid dedicated manual mapping people.
And for sure there will be users left on the curve who are doing imports or automated edits, just not on such a massive scale.
But as rough indication, it could be good to do it anyway. Let’s chop off the head of the graph…
Well I have a confession to make. This red graph I’ve been showing you so far is a fake (Well not quite a fake. It is actually a real long tail graph which Matt made for me, but it’s from about five years ago, and I think it already has imports removed)
Slide 17
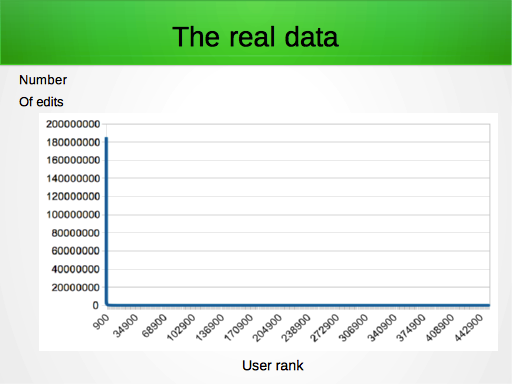
This is the long tail graph with real data (based on changeset dumps from a week ago)
More of an “L” shaped distribution! The spikes are so extreme. There is a curve in the corner there somewhere.
Slide 18
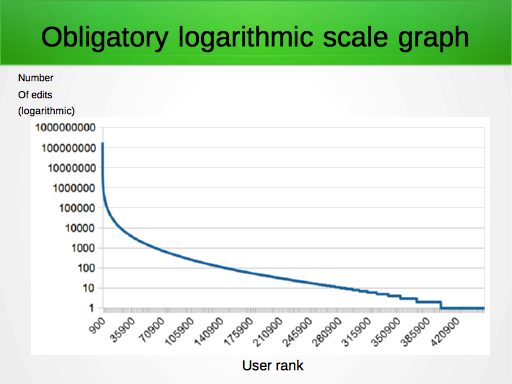
To keep the scientists in the room happy here is the data on a logarithmic scale for the y axis. So that’s one way to bring back the curve.
Slide 19
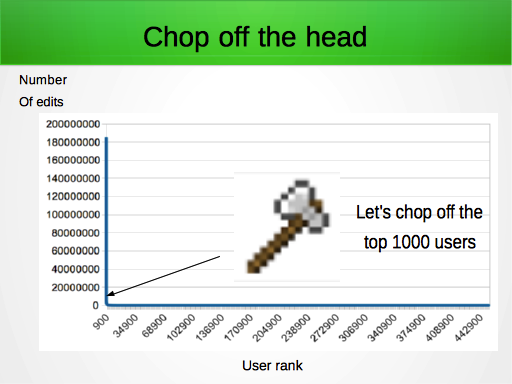
But let’s try chopping off the head to eliminate some of these import users.
Now what we’re actually doing is removing a thin sliver of the users from the left side of the graph. Those who do the most edits. I’m going to remove the top 1000 editors. The effect will be to make this vertical spike much less tall. We’ll re-calibrate the y axis, so we’re effectively stretching the graph upwards
Slide 20
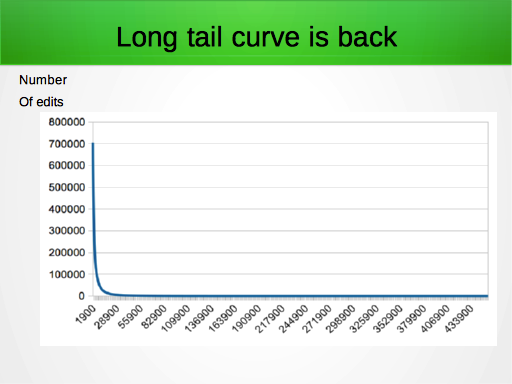
There we go so we’ve got back a bit of a curve now. Our long tail curve is still very very spiky.
Incidentally the y axis now goes up to 700,000. So that’s the number of edits that user ranked 1001 has made. That’s this arbitrary chop-off point, so the 700,000 doesn’t really mean anything much.
What’s important is this curved long tail shape.
Slide 21
So now we can say that these people on the left are the the most dedicated mappers.
Or can we? Well some of you may be having a basic philosophical problem with this whole idea.
Should we be saying the users who make the most edits are the “best”? It can’t be true because quantity does not equal quality.
If you make many many edits, e.g. by fixing up PGS coastlines, that doesn’t make you many times better than a contributor who carefully surveys and maps lots of detail.
Slide 22

This is not unique to OpenStreetMap. Did you know on wikipedia you can view your “edit count”? The number edits you’ve made to the encyclopedia
And the wikipedia community discusses this a lot. Here we see an essay all about it, and we can see the same quality versus quantity point being made. A wikipedian who makes many edits, e.g. correcting spelling mistakes, is probably not many times better than somebody who spends hours and hours writing a carefully crafted article posted in a single edit.
We also see discussion of their equivalents of imports and automated edits, and how these throw the stats.
Slide 23

“quantity versus quality” is an important caveat of this but…
Well maybe we can just say that here on the left we have… kind of the most dedicated mappers approximately maybe.
Slide 24
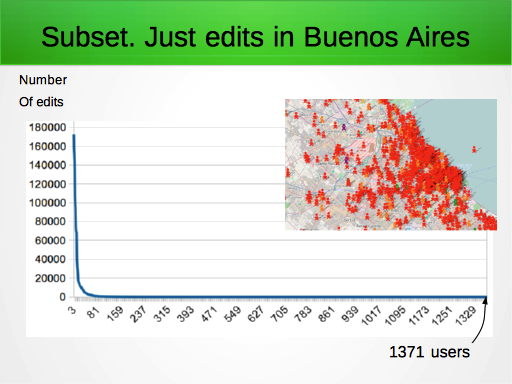
Now we can draw a similar graph for subsets of the data.
Here I have taken just the edits happening in Buenos Aires. There’s about 1371 users editing here by my count
But look at the shape of the graph. A long tail of many users making few edits, and just a thin sliver of users on the left making many many edits in this city. It’s the same shape.
Slide 25
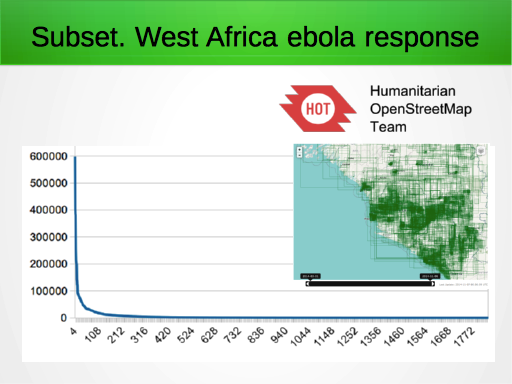
Here’s a graph of people editing in West Africa. This is bounded by time as well, so just taking the edits since March. This way we’re isolating (more or less) just the edits made by all the people working as part of the Humanitarian OpenStreetMap Team response to the ebola epidemic.
And again the same long tail shape of the graph.
By the way this visualisation by Pascal Neis is based on changeset data just as with my graphs. He’s showing the changeset bounding boxes on a map.
Slide 26
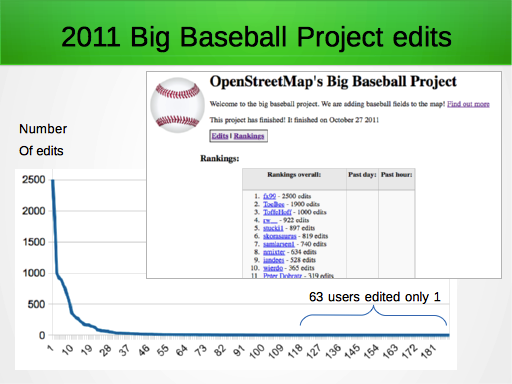
Here’s a much smaller subset. Some of you may remember my Big Baseball Project 2011. At the time I produced a rankings display, and this showed a clear long tail distribution. So there were 187 users taking part. A small sliver of people adding many many baseball fields, and then a long tail including 63 users who just made one single baseball field edit during the period to make it onto the bottom of the curve there.
A much smaller subset, but the same long tail shape.
Slide 27
And actually the long tail doesn’t just apply to map edits.
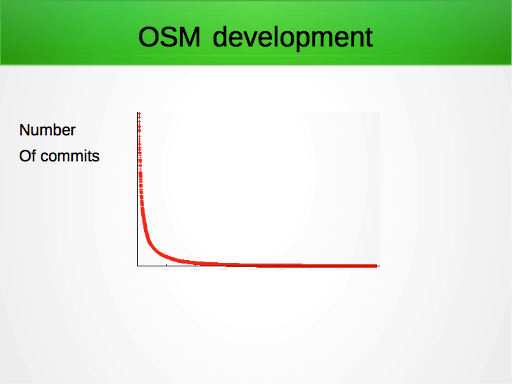
I should have made a real graph of this. It’s very do-able. If I had plotted a graph of code contributions to various github/SVN repos, we would see that development of OpenStreetMap software follows the same long tail shape. Just a few people do most of the development. Many others chip in a little bit.
[Update: Github actually produces a long tail graph under ‘pulse’, but only for the past month: https://github.com/openstreetmap/openstreetmap-website/pulse/monthly ]
Slide 28
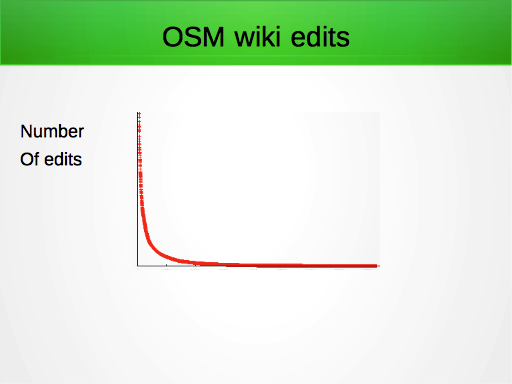
Number of edits people make to the OpenStreetMap wiki, to improve the documentation. You can be sure that will be the same long tail shape.
Slide 29
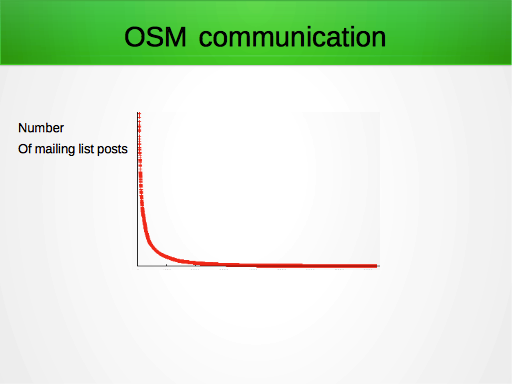
Posts made to the mailing list. Same shape
(Here’s a graph where the people on the far left are definitely not necessarily the most useful!)
Slide 30
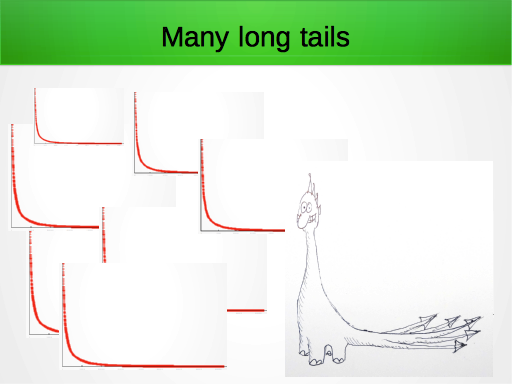
I could go on. OpenStreetMap has many long tails!
Anything which we can get stats for, and plot a graph, will show this same long tail shape.
Slide 31
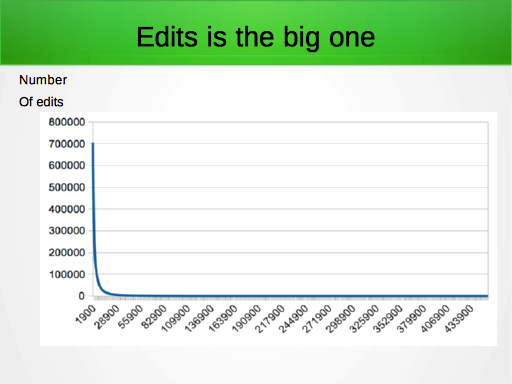
But edits is the big one, and the one I want to analyse a bit more.
Slide 32
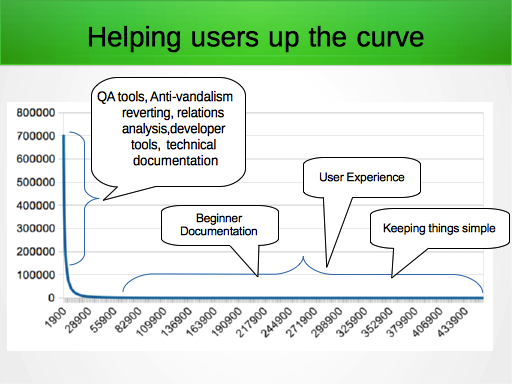
We can use the long tail as a way of thinking about and contextualising a lot things we discuss when it comes to improving OpenStreetMap.
There’s all sorts of ideas which probably fall into a “power tools” category, which will mostly benefit the more dedicated mappers.
Then there’s these big ideas to help the long tail. The new users who still need to learn OpenStreetMap. Better beginner documentation, better user experience, and just this principle of keeping things simple, is for the benefit of the long tail.
We’ve made great progress with some of these things recently. There’s more work to do of course. By working on this, I suppose we’re helping people to climb up the curve.
Slide 33
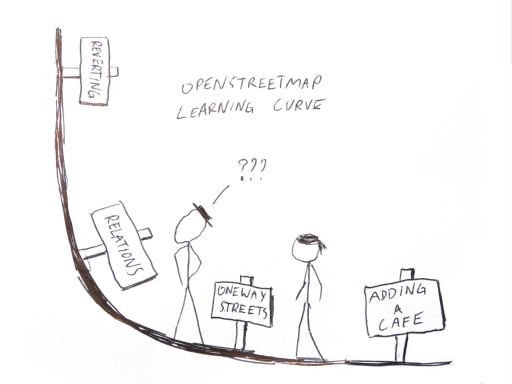
It’s a bit like the OpenStreetMap “learning curve”. Maybe we have such a spiky long tail shape because people find it really hard to become power users. So if we can improve the difficult things like reverting and editing relations, then we can help more people up the curve
But that’s confusing things a bit perhaps because this is a different curve, and actually a user can rack up lots of edits and do lots of valuable stuff without learning power tools. Maybe people shouldn’t have to.
Slide 34
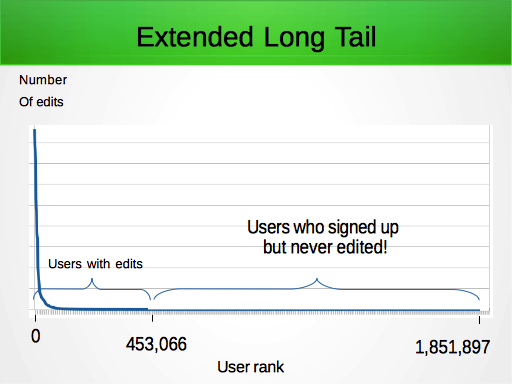
But thinking about “helping people up the curve”, we can actually extend our long tail graph to take account of a much larger long tail of users who have never edited.
It’s a well documented fact (although not everyone may be aware of this) while we shout about having over a million people signed-up to OpenStreetMap, only about a quarter of them make edits. Three quarters of our new sign ups never get as far as clicking the ‘save’ button.
THIS IS FRUSTRATING! Look at the size of this flat long tail!
Slide 35
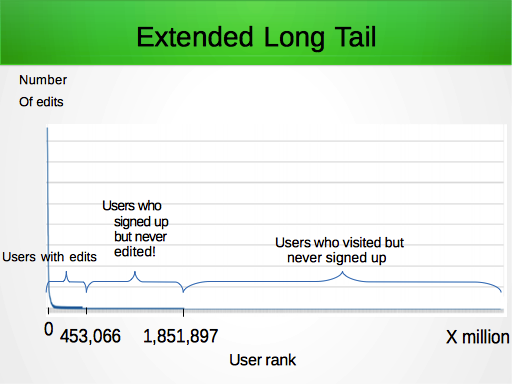
I’ll make it even worse. We could represent the long tail users who visited OpenStreetMap, but never signed up.
I don’t have stats for that, but you can be sure that there’s a very very long tail of many millions of people in this category.
Slide 36
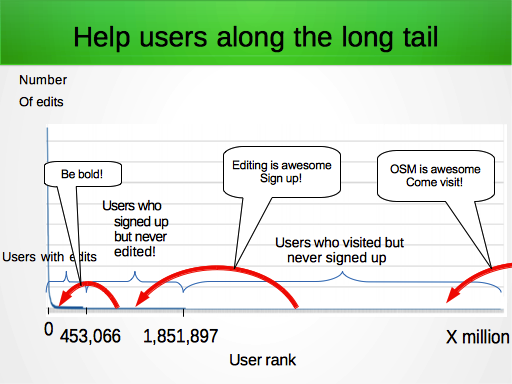
It’s useful to think about, because of course we have to think about the key messages and the key ways of helping people up the curve at these different stages.
On the far right we want to spread the word about OpenStreetMap and encourage people to visit, bringing them onto the curve.
Then we want to encourage those people to sign-up.
Then we want those people to make an edit. I think this is confidence thing, so it’s a “be bold” message. We need to somehow re-assure people that they’re doing right, and they should go ahead and click “save”
Slide 37
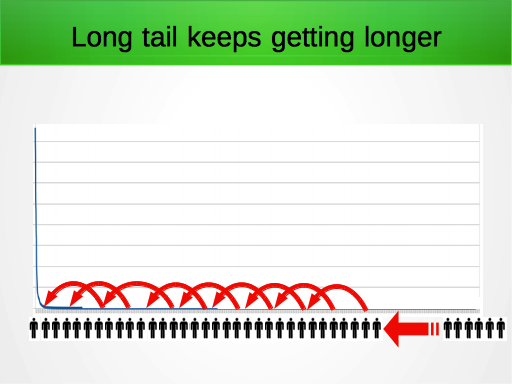
So all these users are hopefully making their way along the long tail from right to left. But actually when you think about that first message “come visit OpenStreetMap”, of course we have a situation where more and more people are joining the end of the long tail.
This is good. It means we can recognise that the long tail is a success story at one level. If many people are visiting the site and joining the long tail, this means we’re doing well at that first message. Successful outreach. We’re getting more press attention etc.
I think it’s also important because it means, even though we’re working to help people up the curve, and we can think of those efforts as trying to balance it out and make our long tail less spiky, we shouldn’t beat ourselves up about this too much, because there’ll always be new people joining the long tail at the bottom of the curve, so we’ll never succeed in changing the shape actually.
Slide 38
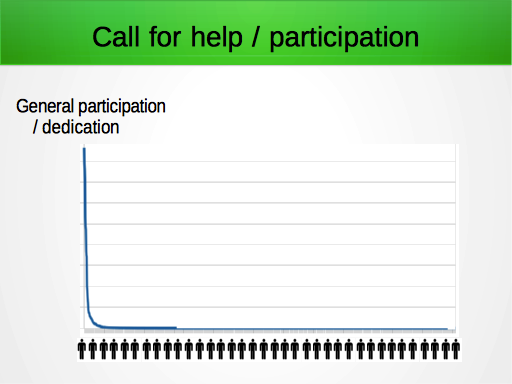
I’ve talked a lot about the map editing curve, but what if we get a bit abstract and just say here’s a graph of the general level of participation and dedication our OSMers have.
This graph explains a lot when it comes to things like trying to build the OSMF working groups, or just generally any situation where we’re putting out a call for help or participation.
We get frustrated at how few people respond. I think it was a mailing list rant from Zverik recently in which he complained that OpenStreetMap is a big community, but it feels like a small bunch of hobbyist programmers. This chimed with me, because when I ask for help with CWG, it feels like I’m shouting into the void, and when we try to get good people into the OSMF working groups, we seem to end up with the same good people we already knew in the first place, who are already busy with other working groups.
I think this graph explains these frustrations. It’s not a solution, although maybe we can imagine some way of plucking good people from the long tail, and getting them into the “dedicated” group on the left.
Slide 39
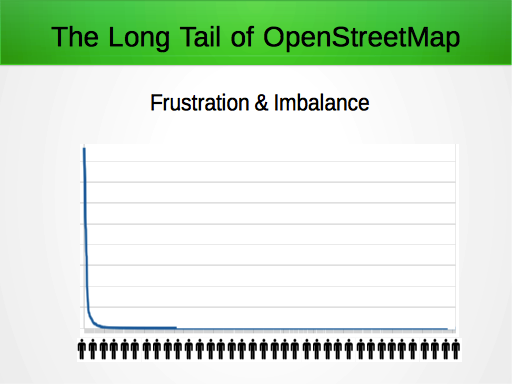
So that’s it. The “long tail of OpenStreetMap”
It’s actually a pretty negative graph of frustration and imbalance. It’s a very frustratingly lop-sided community. You could say it’s negative because my message is very “elitist”. “Hey look at me I’m a dedicated OSMer. Look at all you people making puny contributions” or it’s negative because it’s so unfair that so few people are shouldering most of the burden of “work” within the community.
….Frustration and imbalance!
But there’s a few positives. As I mentioned, there’s new people joining the long tail all the time, which represents us succeeding at outreach. It also means the graph was always going to be this shape anyway.
But I’ll end on another positive message…
Slide 40
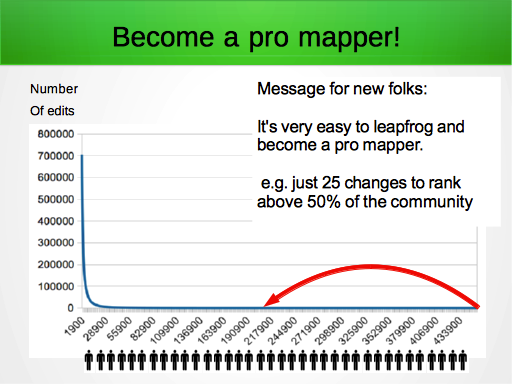
I actually find myself showing the long tail graph to new people as I’m about to teach them editing for the first time. I show them it, and say the following to them…
If you learn to make edits to the map, you actually only need to make a small contribution and you can find yourself ranking above most of the OpenStreetMap community (By my calculations you need to make just 25 edits, and you’re ranked in the top half). You can quite quickly consider yourself an experience pro-mapper, blasting your way up the curve, and capable of teaching other people how to map.
This is because of the shape of the community… The Long Tail Of OpenStreetMap
Slide 41

Thanks very much!
I’ll be around for questions, and I have some polo shirts which I can sell you for 200 pesos!
Jump to slide:
1, 2, 3, 4, 5, 6, 7, 8, 9, 10, 11, 12, 13, 14, 15, 16, 17, 18, 19, 20, 21, 22, 23, 24, 25, 26, 27, 28, 29, 30, 31, 32, 33, 34, 35, 36, 37, 38, 39, 40, 41
3 thoughts on “The Long Tail of OpenStreetMap”