I gave the following talk at “space4” the other day, at an event called “Mapping for change – games and other processes of public engagement“.
My talk was an introduction to OpenStreetMap, which is something I haven’t done in a while. And I also went into more detail on the different ways of contributing, from complicated things like JOSM, right down to the very simple OpenStreetMap Notes.
Space4 is a new funky little tech hub place, of which London has many, but exciting for me because it’s half a mile from where I live! It’s nice to see Finsbury Park attaining this badge of trendiness, but also it’s super convenient. I can even cheekily duck out of family commitments to attend an event for an hour as I did on this occasion, although it was I shame I didn’t get to stick around and chat to anyone. I did get to answer questions, and it seemed like an interesting audience. I’ll have to try make it along to more events there, perhaps more in this series titled “Mapping for Social and Political Change“.
Below are the slides and transcript, or at least what I intended to say. You can also download the slides in OpenOffice format (34Mb).
Jump to slide:
1, 2, 3, 4, 5, 6, 7, 8, 9, 10, 11, 12, 13, 14, 15, 16, 17, 18, 19, 20, 21, 22, 23, 24
Slide 1
I’m going to present my introduction to OpenStreetMap and then, in relation to the theme of this evening, I’ll run through some app and gamification ideas and other ways we try to encourage participation in this project.
Slide 2
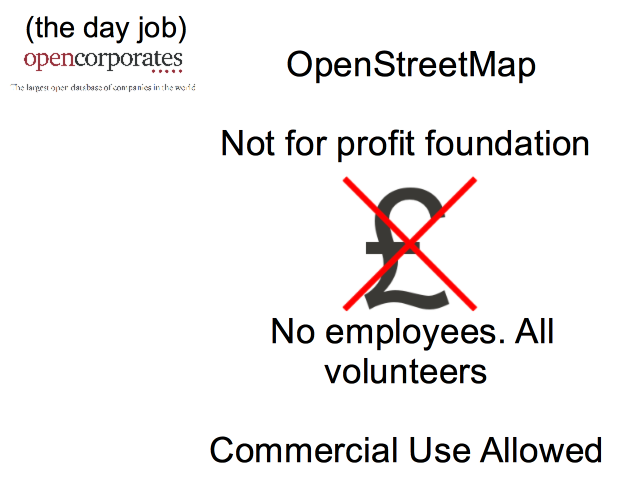
My day job is another interesting open data initiative at a company called OpenCorporates, but that’s a whole other talk! I found this job via my interest in open data and OpenStreetMap actually, but for OpenStreetMap I’m just a spare-time volunteer.
And that’s typical actually. It’s a very volunteer driven initiative. There is a small company called the OpenStreetMap foundation, but there’s only one admin assistant employee. OpenStreetMap is a not-for-profit project with lots of passionate volunteers, although commercial use of the data is allowed, and a number of companies provide services around OpenStreetMap.
Slide 3
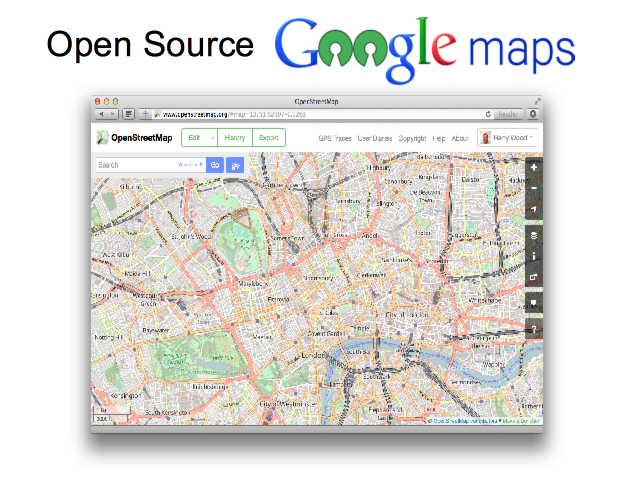
So what is OpenStreetMap? If you’ve only taken a quick look, you’ll perhaps have the idea that OpenStreetMap is a competitor to Google maps. It kind of is that, but that’s really not the whole story.
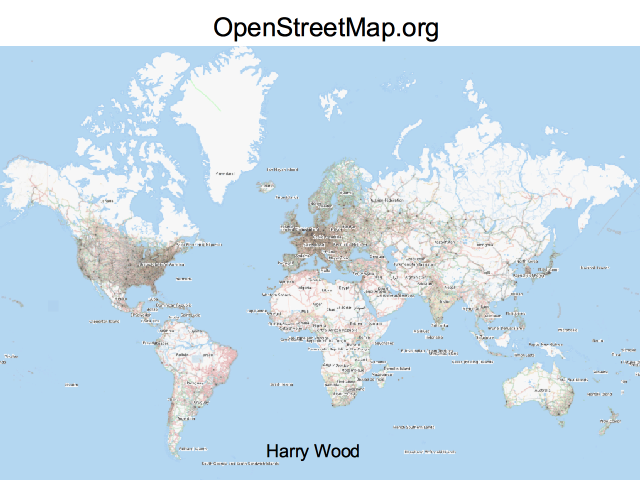
Slide 4
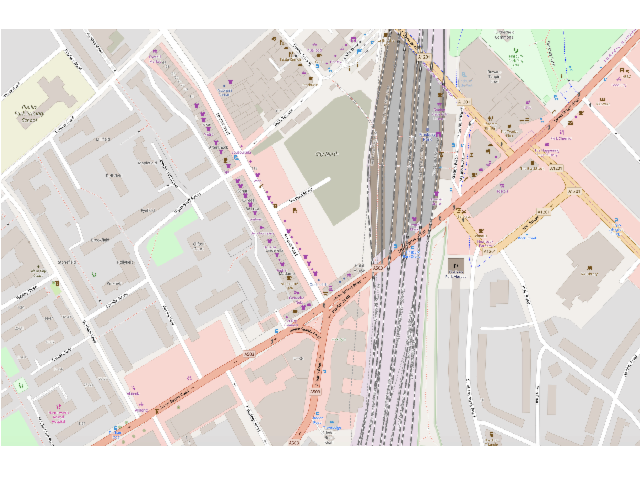
You only have to zoom in on the map and you’ll start to see that this is a bit different. Here’s where we are at space4. In many areas there’s this kind of very rich detailed data, but you can also get the sense, I think, that this is a very human-crafted map.
Slide 5
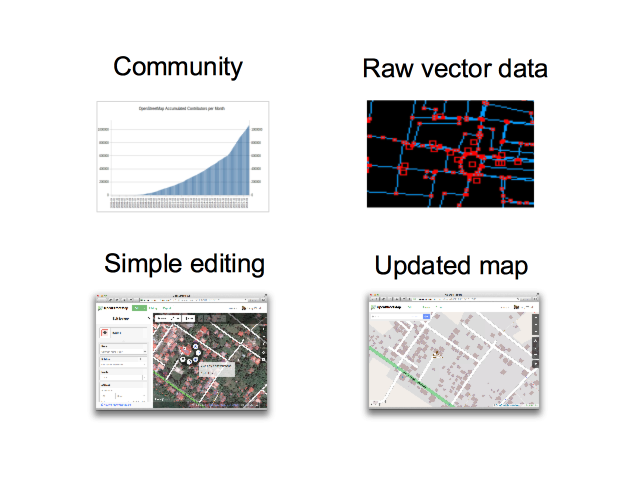
OpenStreetMap is a community of now over 1 million people who have made contributions to the map. It’s a “mass collaboration”, and engaging many people in participation has been the name of the game really.
I’m going to talk more about how we do this, but essentially a key aspect is making the map editing process (which is inherently quite complex) as simple as possible.
The project is called “Open”StreetMap, not just because it is open to edit, but because we release all the data openly licensed as raw vector data. I’ll explain that more, but I think when it comes to community engagement, a key motivator is simply seeing an updated map, taking in the changes people make, and showing a new improved map with a rapid turn-around.
Slide 6
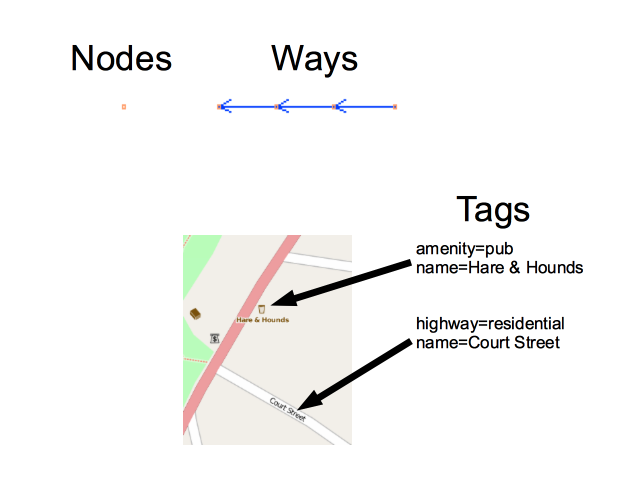
Everything in OpenStreetMap is made up of “nodes” and “ways”. This is what I mean by “vector data”. And then attached this we have “tags”. These name=value pairs.
This is a simple data model, helping drive simplicity of the editors, but particularly with the tags, it’s also very flexible and it means you can put your own ideas into OpenStreetMap for things to be represented on the map. The tags are an interesting aspect of OpenStreetMap’s design which really makes editing simple and fun, even if it means the data is less tidy and usable than it might be. That’s a bias which OpenStreetMap has. A focus on simple fun contributing.
Slide 7
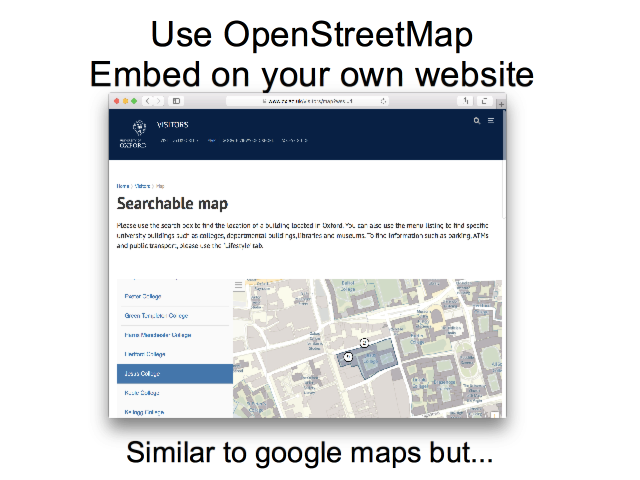
What about using OpenStreetMap?
Well you can do the Google maps thing of embedding a map on your website. Also you can build interfaces involving clickable markers etc, with OpenStreetMap as the base-map.
https://www.ox.ac.uk/visitors/map
Slide 8
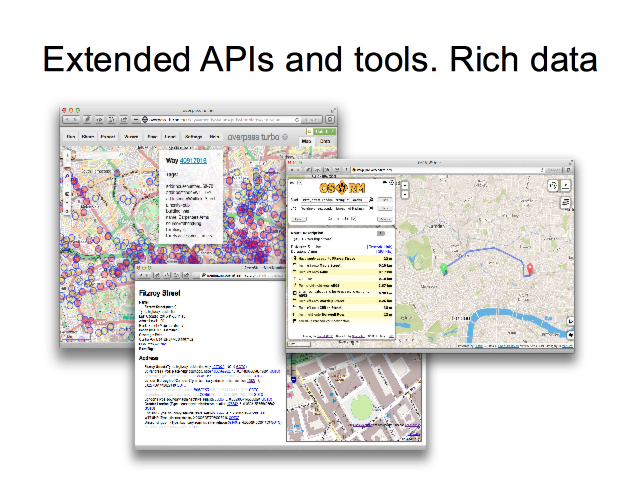
But the raw data from OpenStreetMap has allowed developers to do so much more. Here we see…
“Open Source Routing Machine” doing route planning across the road network.
“OverpassAPI” doing flexible queries within the rich tagging data (show me all the pubs in London)
“Nominatim” search system, finding a street. Here we also see it showing the internals of how exactly that search is matched.
There are endless other examples powerful uses for the low level geo-data.
Slide 9
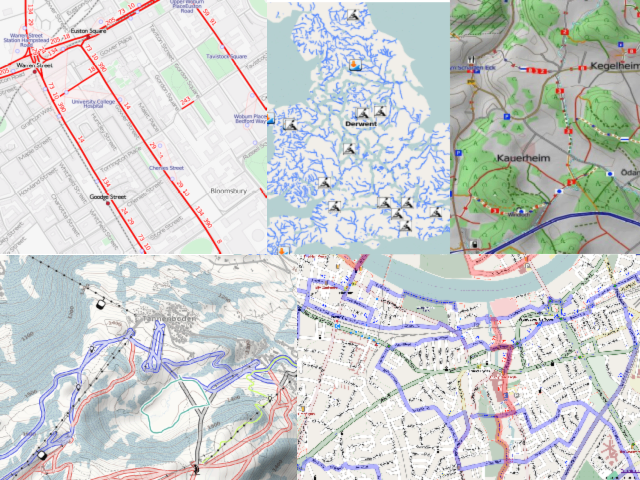
Of course one main use is to have a view of the map. But what kind of view? With access to raw geo-data we can create a customised “rendering” of our map view, choosing different types of data to emphasise and different ways of colouring and styling it.
Top left – Thunderforest Transport Map
Top middle – Quakers Whiterwater map
Top right – hikeandbikemap.org
Bottom left – OpenSnowmap.org
Bottom right – OpenCycleMap.org
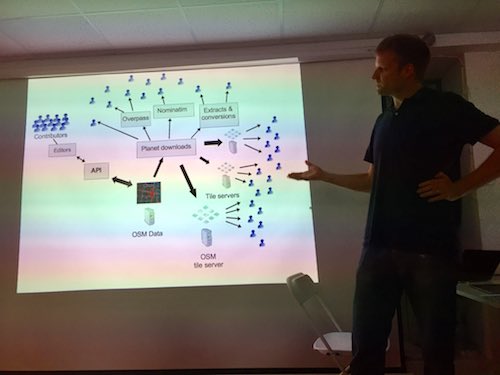
Slide 10
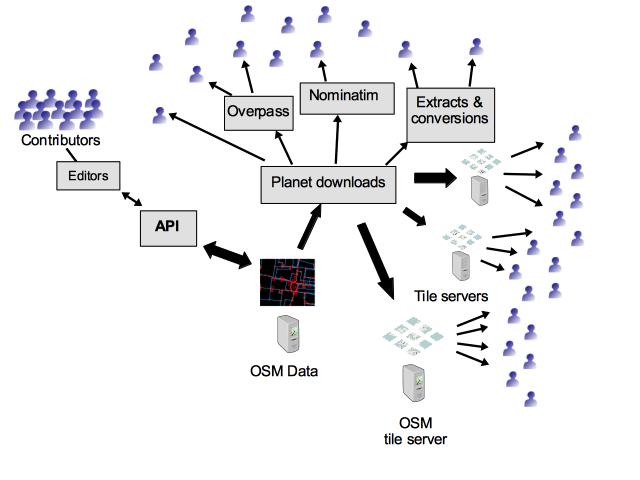
So the raw geo-data flows out from this central OpenStreetMap database, out through an ecosystem of various tools and services which developers are providing and refining (often as open source), out to many many website and mobile apps.
If you’re not a techy developer yourself then this might not seem that exciting, but just think… by contributing to OpenStreetMap you’re not only making a view of a map on openstreetmap.org. The data flows out and gets used in a wonderful variety of different ways.
Slide 11
So I’m going to move on now to talk more about the different ways you can contribute to OpenStreetMap.
I thought I would start with the more complicated ways first, so don’t be put off. I hope to show you that you can contribute in very very simple ways too.
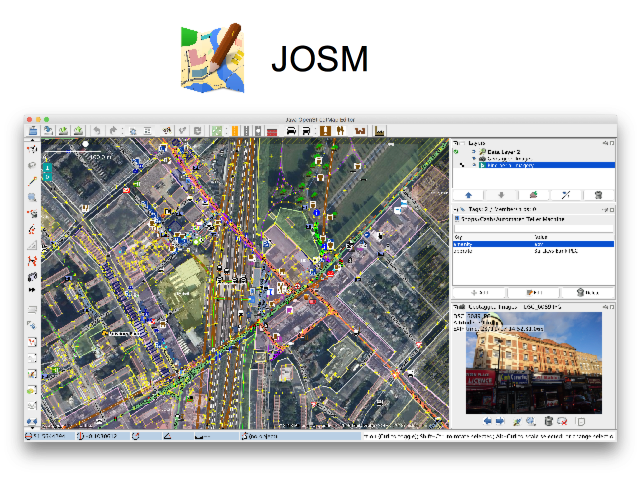
But this is the way I often edit OpenStreetMap. It’s a tool called JOSM. Here we see the photo mapping feature. There’s a photo I took of some shops near here, and little icon here shows roughly where I was when took this.
JOSM is a powerful editor, but actually even if you are just getting started with OpenStreetMap, if you don’t mind learning new software, I recommend diving in and giving JOSM a try, because ultimately it may give the most satisfying editing experience.
Slide 12
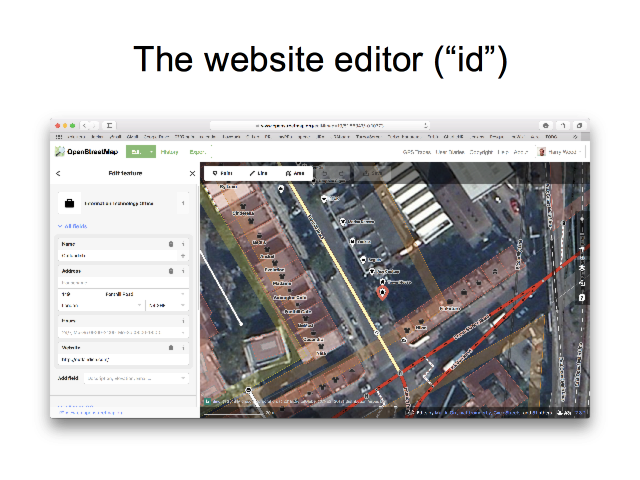
Most people though, will begin by trying the editor on the website. On openstreetmap.org if you click this “edit” button here, you can edit directly with this tool called “id”. No need to install anything.
This is simpler than JOSM, though still quite powerful. It’s easier to get started with.
Slide 13
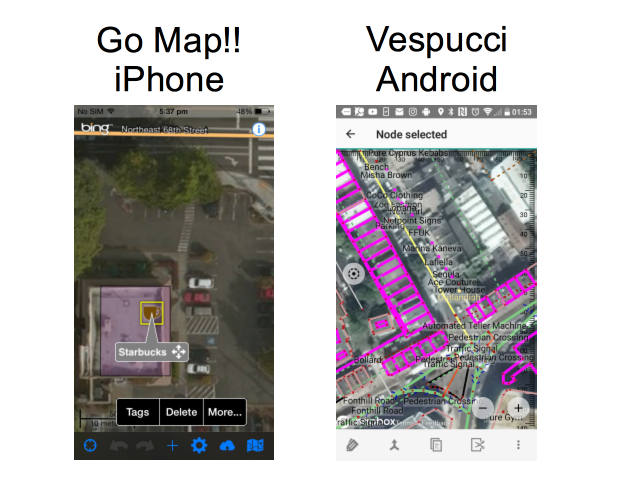
Here’s how you can edit using a smartphone. An app called “Go Map!!” on iPhone and “Vespucci” on android.
These are simplified editing experiences for mobile, however both of these are what I would call “fully featured” OpenStreetMap editors because you can make edits to the “ways” as well as the “nodes” and “tags”. You can edit the geometry of buildings for example.
Slide 14
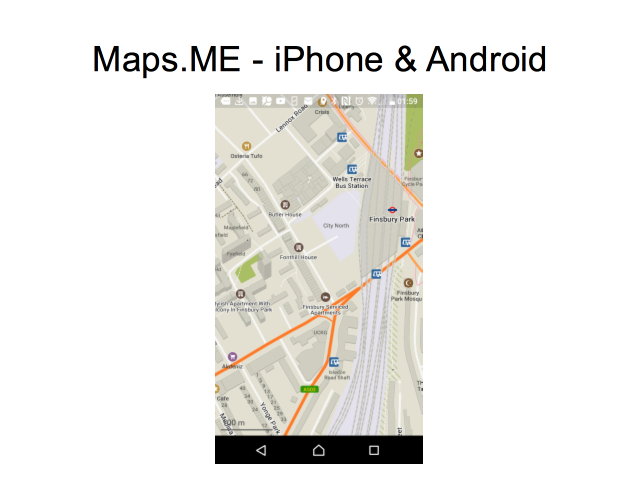
But if I have to make one app recommendation, it would be this: Maps.ME on iPhone and Android is a really great map viewing app. It looks a bit like google maps, so it will feel familiar. But it’s OpenStreetMap! Install it now!
This also lets you download whole countries for use offline, including satnav style routing. It’s great for using without an internet connection while on holiday. But I use it as a really nice useable map view for getting around all the time.
Maps.ME does also have editing functionality. This is an example of a simplified feature-limited editor. You can use it to add a missing shop for example, but only basic edits. It’s not as powerful as Go Map!! or Vespucci.
Slide 15
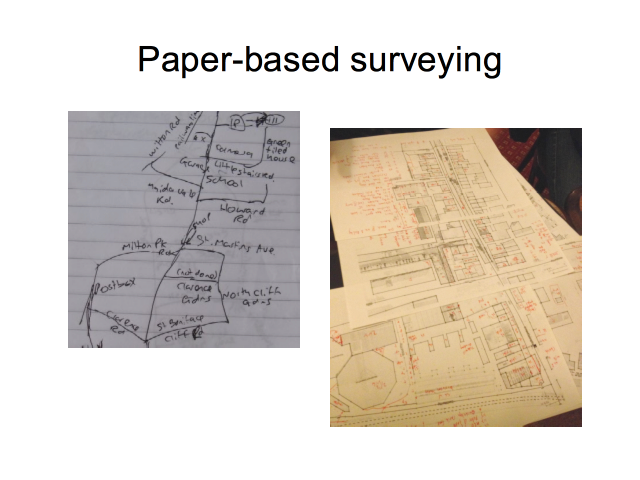
So you can use your gadgets, but I want to stress that gathering data can be as simple as using a pen and paper. Of course you’ll still need to input your data later using JOSM or “id”, but data collection can be very simple and low tech.
…although some people get quite advanced and quite complex with their paper notes!
Slide 16
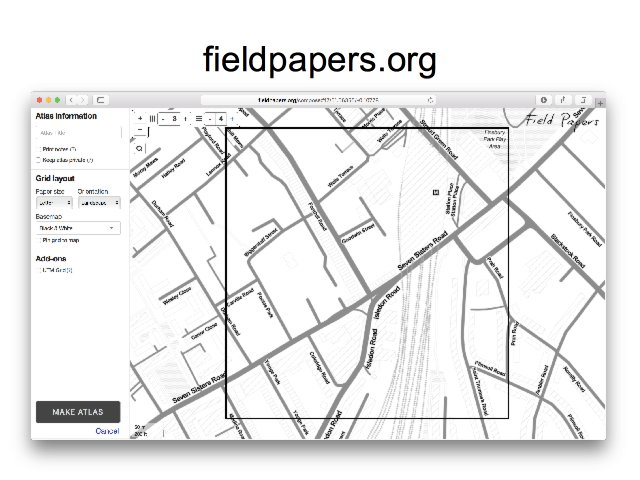
And here’s an interesting tool which bridges the gap: fieldpapers.org
This gives a nice easy way of getting a map printout. It creates an “atlas” of many A4 sheets. Here you see the interface where you’re arranging a grid of A4 sheets to cover an area of interest.
The printouts can then be used for noting down more data which needs to be added to the map. If you want to get clever, these can then be scanned in, and a QR code geolocates the scanned images for use within an editor (but you can easily skip that and… look at the paper!)
Because the data collection is very low-tech pen & paper, this has been used for humanitarian mapping, with local people in Lubumbashi writing down things like street names, and then the paper brought back to London, where we input the data at a fun mapping event.
Slide 17
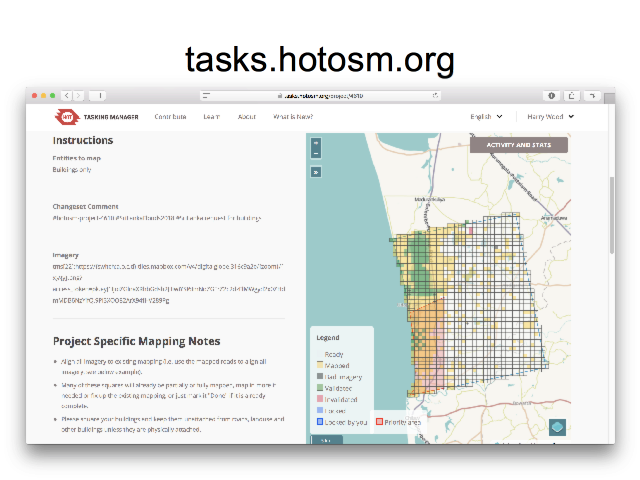
Speaking of humanitarian mapping (this is a whole other area I didn’t go into) check out the “Humanitarian OpenStreetMap Team”, and a project called “Missing Maps” which is having very popular events every month here in London.
But this is a tool we use to coordinate mapping a lot. The “Tasking Manager” at tasks.hotosm.org. You can see the idea. We divide up an area into a grid. The yellow squares have already been done, and you can acquire a square to work on. It’s a coordination tool which means we don’t accidentally work on the same area even if we have a large number of people mapping.
This is for remote “armchair mapping” where we can sit at home with our laptops and contribute using aerial imagery, to draw around buildings for example.
Slide 18
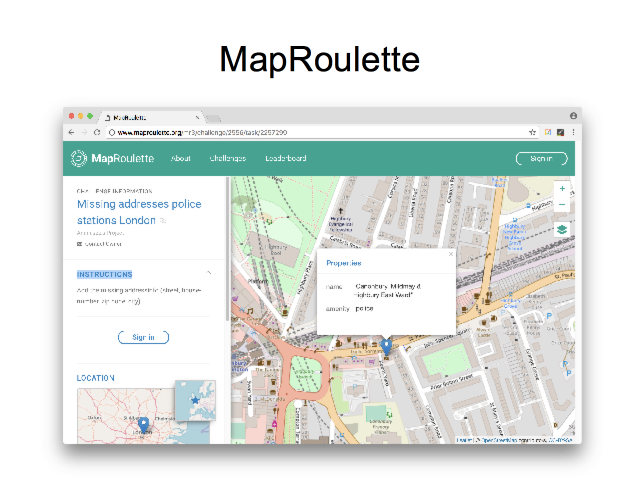
Getting more towards “gamification” side of things, this is a tool called “MapRoulette”. It assigns random little tasks for you to work on (by making edits in the OpenStreetMap data)
Often the “challenges” are created based on data from external sources. Here for example it’s showing Police stations in London, where we could be adding some address data, taking the addresses from some government dataset. So we spin the roulette wheel, and we’re shown a random London police station, and we click to add the address data and then go again!
Slide 19
I wanted to show you a couple of really simple ways of helping OpenStreetMap which don’t involve learning how to edit.
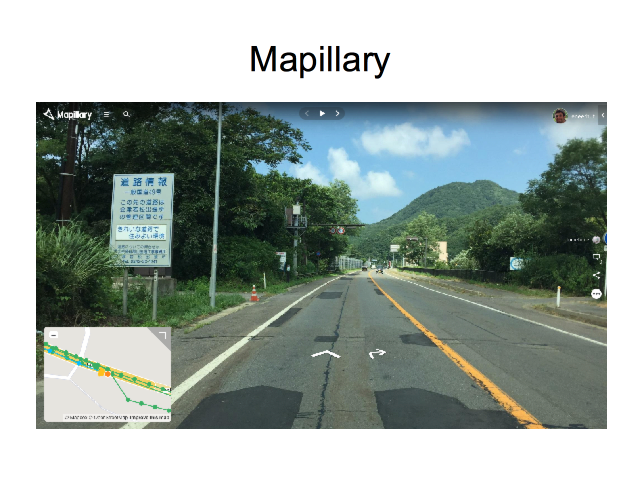
Mapillary is a thing you can contribute to, particularly if you drive a lot. You simply set your phone going taking photos as you drive, and these form a thing a bit like Google StreetView.
But Mapillary works very closely with OpenStreetMap, and allow us to use the images while editing. If we gather enough of these street-level images, it becomes a very powerful supportive tool for OpenStreetMappers. We can easily use it to double-check our data and directly add things like missing shops.
The app is really easy to use because contributing is very passive. You just sort of set it going, and you can almost forget about it. Later you upload lots of photos.
Slide 20
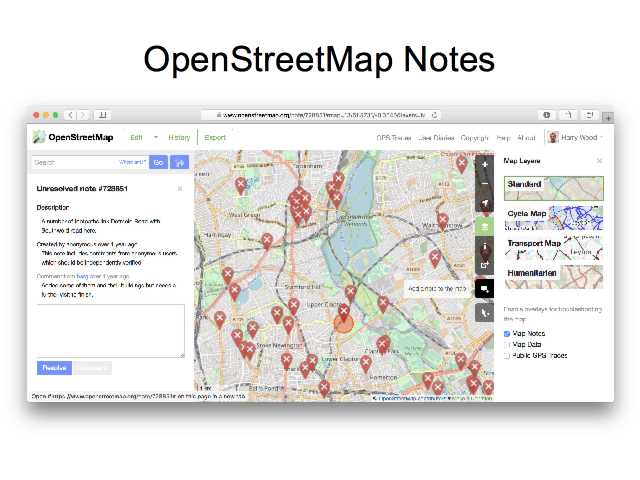
Finally this is perhaps the simplest way to contribute OpenStreetMap: A thing we call “Notes”. Just go to the website and click this button here to add a note. Place a marker and write a textual description of a thing which is missing or needs to be changed on the map. Easy! It doesn’t even require you to log in.
Like Mapillary this is a slightly indirect way of helping. It still requires people who know how to edit, to then go and make use of this information to edit the map.
But this is very much designed to be a very simple way to contribute. It’s dead easy, although do make sure you zoom in and place the marker precisely, and be as descriptive as you can in the text.
Slide 21
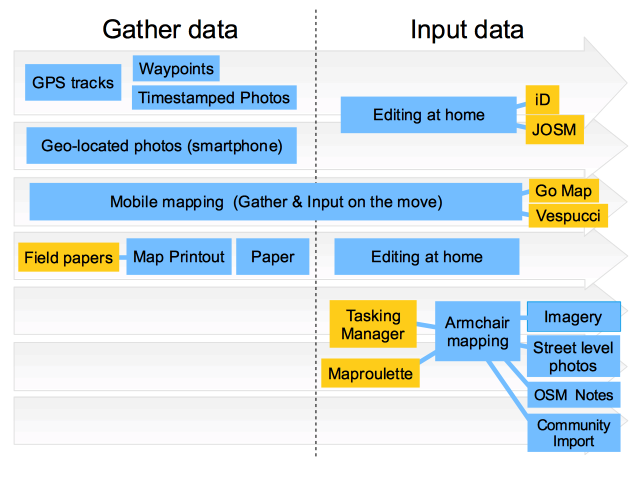
Here’s a summary diagram showing different ways of contributing.
It’s split into “gathering data” and “inputting data”, because often we do things in those separate stages. The mobile mapping approach using Go Map!! or Vespucci will cut across these, because you can make the edit directly while you are out and about seeing things to add. This is perhaps not as useful as it sounds because, tapping away with your finger to add all of data is very slow. If you’re adding lots of things, or even if you’re casually doing some fly-by mapping, I tend to prefer a two stage approach. I snap quick photos on my phone (which are geo-located), and then later at home I view these with JOSM to add the data.
We also talked about Tasking Manager & MapRoulette. These options at the bottom only involve a data input phase without the need for data gathering. But as with the other projects we’ve heard about this evening, OpenStreetMap is a great excuse to go out and look at the world! If you like that sort of thing, you may prefer these other modes of contribution.
Slide 22
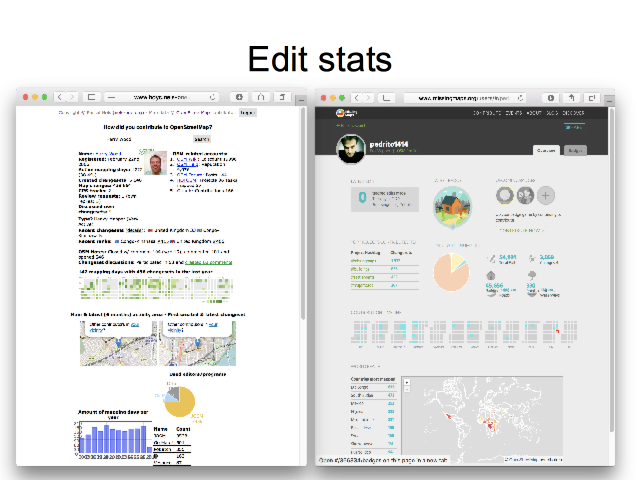
Beyond editing tools, we also have a few tools like this which show us stats on our OpenStreetMap editing. This helps make editing fun and engaging, and naturally a little competitive! This is “how did you contribute?”, and on the right a tool on MissingMaps.org which shows edit stats related to humanitarian mapping with the tasking manager.
Slide 23
So that’s OpenStreetMap!
Do check out the @OSMLondon twitter account for news of OpenStreetMap events happening here in London.
Thank you very much!
Slide 24
For my part, I release these slides under the Creative Commons Attribution-ShareAlike 2.0 License
However see the notes on the slides, for other specific attributions.
Any standard OSM map images are cc-by-sa2 OpenStreetMap contributors.
Jump to slide:
1, 2, 3, 4, 5, 6, 7, 8, 9, 10, 11, 12, 13, 14, 15, 16, 17, 18, 19, 20, 21, 22, 23, 24
Hi,
This is much needed and in detail tutorial to contribute to Openstreetmap.
Thanks a lot.