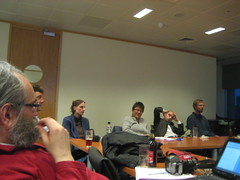
Bus route rendering at RewiredState

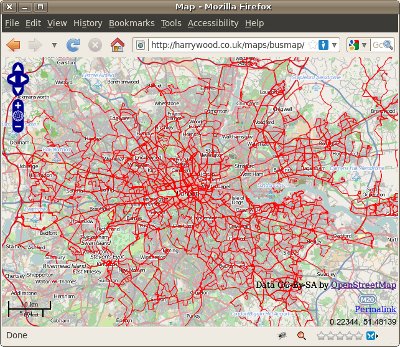
I made a bus map.

bus map

Not just an image, but a dynamic “slippy map” rendered at several zoom levels.

This was my “hack” for the RewiredState, National Hack the Government Day”, a gathering of hackers who build something in a day, with the aim of tackling government/society problems, working with government data. Projects are presented at the end of the day.

I created the bus map by “rendering” OpenStreetMap data. By this I mean starting from raw map data, the underlying vector data, the coordinates and connections of every road etc, and creating raster images arranged in tiles at several zoom levels, for the map display linked above.

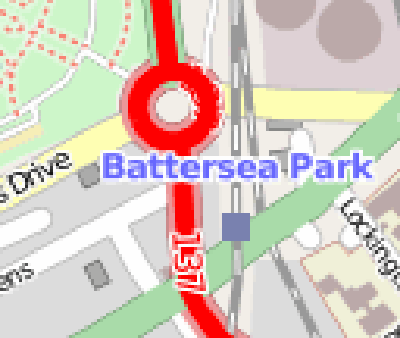
Clearly within the graphics routines this bright red routes data is drawn in a particular order, and in a sense it is laid on top of the map, but it’s important to realise the routes are baked into the raster images. This isn’t a javascript overlay. Rendering data in this way has advantages and disadvantages over javascript overlays. An advantage is that we can show all the bus routes of London when zoomed out, without crashing the browser. Other advantages are in the subtleties of how you can make the map look. I haven’t really demonstrated this very well here yet, but I hope to make some improvements. If you look closely some tube station labels are drawn over the routes, which at least shows it’s not an overlay. There are other (better) OpenStreetMap rendering examples elsewhere

bus map close-up

Getting the data

You can download raw OpenStreetMap vector data for the entire planet. In fact I took an england extract in PBF format offered up by geofabrik. From this I just chopped out the London area (this bounding box) using the tool “osmosis” with this command:

wget http://download.geofabrik.de/osm/europe/great_britain/england.osm.pbf

$OSMOSIS_HOME/bin/osmosis \
   --read-pbf ./england.osm.pbf \
   --bounding-box left=-0.543 right=0.337 top=51.719 bottom=51.253 idTrackerType=BitSet \
   --write-xml ./london.osm

Once I had london.osm, it was time to put this through the Mapnik rendering tool. Very broadly the steps were:

  • Install Mapnik. In fact this is several steps, but happily I already had it installed. The ‘Build your own OpenStreetMap Server’ tutorial by Richard Weait was useful for this
  • Load the data into postGIS with a command such as ./osm2pgsql -S default.style --slim -d gis ./london.osm
  • Edited ‘generate_image.py’ to render a single image in central london as a test
  • Edit ‘generate_tiles.py’ to specify the london bounding box and zoom levels. Initially I’ve rendered zoom levels 7 to 15.
  • Run ‘generate_tiles.py’ to create the tileset (png files in a directory structure)
  • Made a HTML file with the javascript to launch OpenLayers fullscreen pointing at these tiles (do ‘view source’ on the site to see the javascript for this)
  • Copied the stylesheet file ‘inc/layer-ferry-routes.xml.inc’ to make a new style layer for bus route relations (thanks to SK53 for suggesting this)
  • Reference the new layer in osm.xml, and ‘inc/layers.xml.inc’
  • Test using ‘generate_image.py’ before re-running ‘generate_tiles.py’ to re-render the tiles.
  • Added more rules for varying thicknesses and a TextSymbolizer for showing route labels

My busmap stylesheet so far: style.tar.gz

öpnvkarte

Among the list of rendering examples linked above, is the one called “öpnvkarte.de” which shows bus routes throughout europe. In fact this is one of the best examples of customised OpenStreetMap rendering. Really nice colour and style choices with subdued colours for the background features enhancing the bold transport lines very clearly. So bus route rendering has certainly already been done. What’s the point in my map then?

öpnvkarte is very german. It’s named after a german transport network. The map is quite literally centred on Germany, and you’ll have noticed it has an un-typeable german character in it’s URL (although Shaun has provided openbusmap.org as a more sensibly named proxy). Petty irritations perhaps. So what else?

As far as I’m aware öpnvkarte hasn’t been updated in a while, so by re-rendering today’s openstreetmap data, we can see how the community has progressed with adding more routes. I was slightly disappointed to find that there wasn’t much difference in London actually. Just one or two details. Compare here with here. But OpenStreetMap people tend to be motivated a lot by renderings and other uses of the data they’re gathering. If the bus map stops being updated, then people stop adding bus routes.

There are other things which are less than perfect about öpnvkarte. It’s not a worldwide rendered tileset. It went worldwide for a few weeks but the server didn’t manage to cope. (I know my map is obviously not competing very well. I just rendered tiles for London!)

Wordwide tile rendering and re-rendering of updates, are tricky technical challenges. Obviously the developer of öpnvkarte is under no obligation to do these things, it’s just a shame that he doesn’t. More of a shame is that he doesn’t (as far as I’m aware) share his stylesheet config files. Again he’s not obliged to do so, and given the amount of work he must have put into it, perhaps it’s understandable. But sharing stylesheets would allow people with hardware and tuning know-how to have a go at tackling these other hosting challenges.

So those are a few weak justifications for starting all over again and attempting to build a different bus map stylesheet. My mapnik config files are hopelessly rudimentary so far, but it’s a start. Mostly though, this is just another baby step in my slow climb up the Mapnik learning curve. I wrote a diary entries back in January about this, but until this weekend I hadn’t tried anything further.

RewiredState
It was good to get up and present this rendering idea at rewiredstate, to a bunch of hackers and data mashers who I think would find this sort of thing interesting to play with themselves. I know a lot of them will reach for the boring old google maps toolsets for their map mashing work, but hopefully I gave a hint at some of the raw power and rendering fun offered by OpenStreetMap. Perhaps I should have made this important point again though: You can just use the familiar google maps javascript API on top of OpenStreetMap basemaps!.

The important point I did remember to make in my 2 minute slot: Next weekend we’re having a London OpenStreetMap hack weekend. I must try to prepare this time!

Thanks to the hard working RewiredState organisers and their sponsors (wired uk, tso, dxw) for a great day, and for all the free penguin biscuits and beers in the pub afterwards.

UPDATE: New transport map from Andy Allan. My friend Andy is creator of OpenCycleMap and all round Mapnikmeister. Unveiled today (14th April), his transport map is auto-updated and rendered worldwide (how are your local buses looking?) with beautiful pale shaded background cartographic choices. I think we can safely say I’ve been outdone on this one 🙂
BeingOpen talk and business impacts of OpenStreetMap

Yesterday I gave a talk about OpenStreetMap at BeingOpen.

BeingOpen OpenStreetMap Slides on slideshare

And here’s a blurry picture of me talking Can you tell I’m really trying not to wave my hands around?

I always imagine my slide decks will be quite re-usable, but things change a lot in OpenStreetMap. My normal intro to the project needed updating to feature Potlatch 2 and a stats update of course.

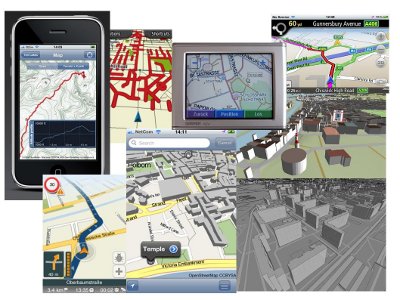
For eye-candy uses of OpenStreetMap there are a few nice new examples. Many of these are nice looking mobile apps, and I was pleased to be able to sneak in a plug for placr’s UK TravelOptions app. The other things I added were Skobbler, and the new glosm 3D engine.

OpenStreetMap use cases eye-candy

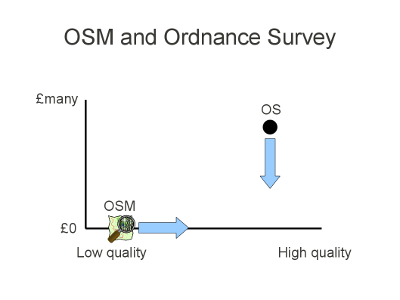
But besides the normal intro, I tried to talk in broad terms about business aspects of OpenStreetMap. This is a classic graphic copied from Steve Coast, which I think explains the disruptive impact of OpenStreetMap very well.

OSM and Ordnance Survey slide

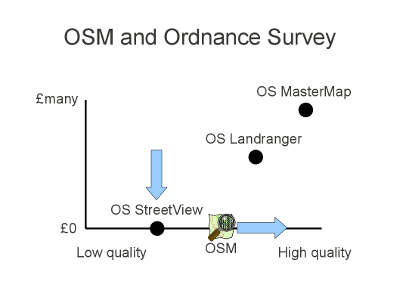
As OSM quality improves, at zero cost, it exerts a downward pressure on the price of traditionally licensed datasets. Of course in the case of Ordnance Survey, this also needed updating:

OSM and Ordnance Survey Updated slide

Ordnance Survey released some of their datasets for free. I believe StreetView is the most detailed. Whether OSM is better or worse than Streetview is debatable (position on the horizontal axis), but when you consider that StreetView is a raster map, OSM is potentially much more useful (all depends on your use case)

They definitely have not released all their datasets for free. The popular “Landranger” maps? Still charged for. “MasterMap” is the super-detailed dataset which you still pay through the nose for as part of the planning process. OSM isn’t really trying to reach the level of detail of MasterMap, but may perhaps exert a downward pressure on its price point.

So in a way OpenStreetMap (and other open data initiatives) are all about destroying business models. Traditional map providers have enjoyed a great business model: Licensing their maps. OpenStreetMap is disruptive technology which swings a wrecking ball through these monopolies.

destroying business models

But in the wake of this demolition, there are new geodata niches which are much more interesting. Small companies can get involved map service provision where previously they wouldn’t be able to afford data licensing fees. I’m not going to lie to you. Finding a money-making niche in this landscape is a challenge. The people that undoubtedly benefit are the “end users” of maps. Businesses / website ideas which make use of maps tangentially to their core business model. These people have new and exciting map tools, and access to free data, thanks to OpenStreetMap. I followed up with some ideas for different levels of OpenStreetMap use, which I have described in more detail on the placr blog.

(Wrecking ball photo by Rhys’s Piece Is on flickr)

London Wiki Wednesdays – February 2011

We had another London Wiki Wednesdays this week.

For me a strange kind of circle was completed. Back in October 2009 I blogged about how London Wiki Wednesdays had helped open my eyes to more interesting possibilities for working with fun technology. At the time I’d just quit a more dull/frustrating job, in which I worked as a Tibco consultant. Tibco do big expensive “enterprise” integration software for banks telcos and other big business. Not particularly fun technology. So it was weird to hear Tibco’s name come up in relation to “social media”, as David Terrar talked about their new Tibbr platform.

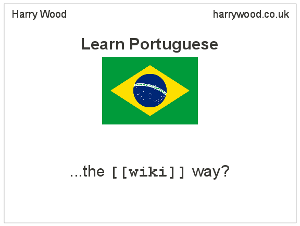
I gave a talk, and rather enjoyed turning my attention back to wikis and away from OpenStreetMap and all things geo for a change. Rather like OpenStreetMap, which is always delightfully intertwined with “the real world”, I find it quite easy to imagine ways of collaborating on wikis in relation to almost any facet of real life. That’s something I chose to demonstrate with my talk. I wanted to tell a fun little story of dipping into wiki collaborations and wikibooks.org as I aimed to learn Portuguese.

It’s a true story. A very short story (good for a 5 minute speaking slot!) and it sort of ends with this discussion here. …so far at least. If you want to be involved in what happens next, join that discussion I guess.

But there’s another thing happening next. I started learning Android app development, and after running through hello world tuturials, and diving into other people’s code at work, I was itching to make my very own Android app. This little vocabulary quiz app is a very fledgling creation at the moment. Only slightly better than a hello world tutorial, but I hope to do some more work on it soon:

android-app

…I also hope to find time to actually learn some Portuguese!

There’s a full list of presentations and links to other blogs posts etc related to last Wednesday’s event. They’ll be a london wiki wednesday pub meet-up next month, and hopefully another evening of presentations in April.

placr tube-radar

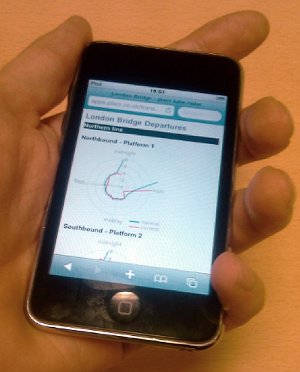
placr Tube Radar on an iPhoneHere’s something I’ve been working on at placr:

>>>> placr.mobi <<<

[Update:placr.mobi is a bit different these days, but the tube stuff is actually available at http://placr.mobi/timetable?u=uk%2Ftube ]

Have a play with it. The site is designed to work well on mobile screens. You can get to it by typing “tube-radar.com“. [update: These days that’s also something different. Sorry for the confusion]

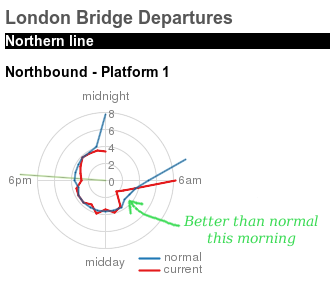
The red and blue lines indicate tube performance in terms of “headway”. The time between trains. Closer to the centre means shorter headway (good!) further from the centre means… waiting around a while.


placr Tube Radar at London Bridge

You can compare the data over the past 24 hours (red) with the “normal” levels (blue) which are averaged over a longer time period, but at the same platform and same time of day. Hopefully this will give an indication of how good or bad or erratic your service is likely to be today.

If you’ve chatted to me about what I’ve been doing at placr, you’ll have noticed I’m fairly hopeless at describing it. So hopefully this will give you a better idea, although this is only part of part of what I’ve been doing. We decided it was time to bring some stuff to the public-facing surface from one of our projects. We’ve spent a while gathering and analysing performance metrics of the tube, and this is one kind of output we’re seeing. To get this out in time for the tube strike was a bit of a last-minute rush, so it may look rough around some of the edges, but here’s hoping some people will find it useful (or at least interesting) over the period of the tube strike.

Trip to Shanghai

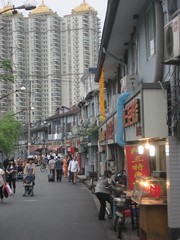
Last week I went to China. You know, that place where everyone lives. In fact I was in Shanghai, the most populous city in the world (by some definitions)  I’m kind of ashamed to say it’s the first time I’ve been to Asia. My bounding box just got a whole lot wider. I was invited there to give a talk on OpenStreetMap and the Haiti story, which was a fantastic opportunity in itself. I shall blog more on that (coming soon)  but just being in this mega-city was an amazing experience, helped along by some excellent hosting.

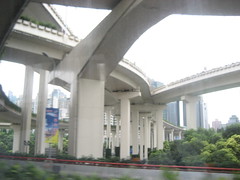
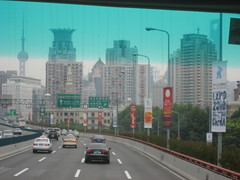
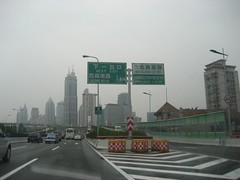
Buses and taxis whisked us around the brightly lit streets. I was always impressed by the neon-lit multi-level flyovers and spaghetti junctions:

Shanghai Shanghai flyovers Shanghai Shanghai

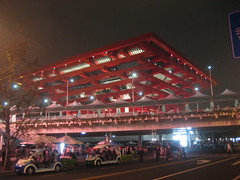
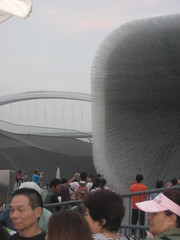
We had  a trip to the Shanghai Expo. VIP access allowed us to mostly skip the gigantic queues, although amusingly we were denied this at the UK pavilion:

Shanghai Expo Shanghai Expo Shanghai Expo UK

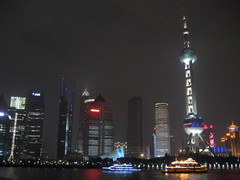
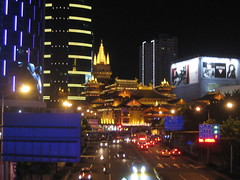
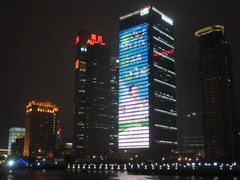
We had some time to take in other Shanghai sights. The night-time boat trip was particularly spectacular:

Shanghai Shanghai Shanghai temple Shanghai

We had a look around the antique market and other shopping areas:

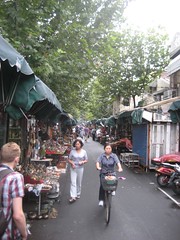
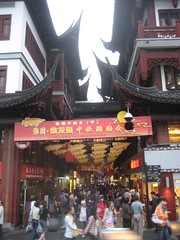
Dong Tai Road antiques market Shanghai Ancient chinese shopping plaza

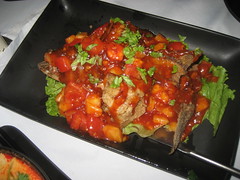
We had some wonderful (and sometimes weird) chinese meals:

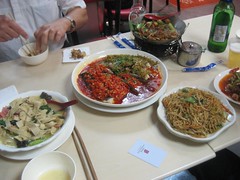
Fish in sweet sauce Roast Duck Moon soup No english menu

All in all a pretty spectacular travel experience. I thought I’d put a few photos here in case you missed my usual showing off live-photo-streaming while I was out there. More pictures on flickr.This wasn’t a holiday though. As I said, I need to follow this up with some more details of the OpenStreetMap talk I gave, and thoughts from the conference.

Cycling to work in London

I started cycling to work about four weeks ago. Yes. I took the plunge and became a “London cyclist”.

Cost was the first thing putting me off. I considered a dodgy Portobello road market £50 bike, or a more ligit second hand one for about £100 from Camden cycles [scruffy bike shop which no longer exists]. Then pondered whether it’s worth spending that much when the bottom end new bikes (e.g. halfords or decathlon) start at about £150. Then I realised that the bike is only part of the cost. There’s the padlock, lights, hi-vis clothes, and helmet to buy. So does this mean I might as well spend a bit more on the bike? I probably would have ummed and ahhhed about that forever, but then I found an old cobweb-covered brown bike in Grandma’s garage. Problem solved!

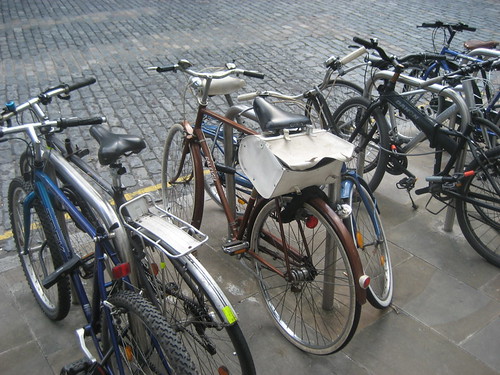
New bike parked

Of course, as long as you use the bike to commute, saving tube fares, even quite expensive biking equipment pays for itself within a few months. I really wasn’t sure if that would actually happen though. There were a few other things I was worried about:

Death, and the danger of it. I always perceived cycling London streets to be quite a dangerous undertaking. I think most people do. I’m cautiously learning how to do it, having only ever cycled on the hilly country roads of Holmfirth half a lifetime ago. I now have a more first-hand appreciation of cyclestreets.net and their very nifty display of three levels of cycling routes: quietest, fastest and balanced (try it!) My journey to work has plenty of options, and I can mostly stick to quiet roads, but in fact that’s probably true of most London journeys.  I was nervous about crossing big junctions like on Holloway Road here, but actually traffic lights usually allow a little rest, and then saftey in numbers as a whole flock of cyclists make the same crossing. Meanwhile more minor junctions like at Offord Road have yielded my closest encounters of a near-collision kind. I haven’t died yet, and on the whole it feels a lot safer than I was expecting.  Plus the exercise will be doing my life-expectancy some good.

Punctures. So far I’ve had none, but my cycling buddies have talked a lot about them, so I guess it’s just a matter of time. I imagine this will be a big pain in the ass, but as long as I can go a while without it happening…

Oily Brokenness. So far I’ve had none of this either, although my handlebars seem to be coming slightly loose. I noticed London bike shops don’t seem to sell a full “toolset for cyclists”. I found one during a trip to Amsterdam (along with a cheap padlock) So yes. I have tools. I think I’m ready for some oily brokenness, as any man should be right?

Sweatyness. I don’t have shower facilities at work, so I thought this might be a problem, particularly in the summer. But again, not as bad as I had expected. I guess you never really get the heat of the sun at commuting times, and fortunately my route to work is vaguely downhill (cyclestreets.net shows nice altitude profiles too)  I change into a fresh T-shirt when I arrive, and hopefully don’t smell much.

Drunkenness. I imagine having a bike could be a bit of a drag when I want to have a spontaneous after-work drinking session. I don’t seem to be doing that much these days (open to invitations), but I’ve noticed my cyclist friends have developed a knack for drinking sensible numbers of pints. Not really something I’m known for.  Bah! …surely I can ditch my bike somewhere safe enough (or I could drink sensibly I suppose)

Cycling in the rain
Bad weather. Will I just be a fair weather cyclist? This also remains to be seen. I wasn’t a fair weather cyclist on the way home last night. In the gathering darkness and rain (and perhaps even a bit of an autumnal cold wind) it felt pretty miserable. It wasn’t even raining hard, but I got absolutely soaked. But I kind of enjoy facing the elements. The rain made me day-dream about kayaking as I cycled along, and I made it home well enough. I guess it gets harder as the weather gets more severe. If it’s too miserable I will give up and take the tube.

But let’s not forget the people cramming onto tube carriages would’ve had a fairly crappy journey too. This is the best thing about cycling to work. For most people (millions of people) the commute to work is dead time. Sure you can try to make use of time spent on the tube. I got really organised about making sure I had a good book to read, but even so, the daily drudge of “mind the gap” and “move right down inside the carriage” was really starting to grate. It feels fantastic to have escaped it. Journeys to work feel like a lively and invigorating time now. Not only that, but I can actually get into work in 30 minutes instead of 45!

Becoming a London cyclist is a bit of a leap into the unknown, but I now feel stupid for not having tried it earlier.

Talks and thoughts on OpenStreetMap mapping parties


(photo Copyright All rights reserved by SINFOGEO)
A few weeks ago we had a big OpenStreetMap conference, the annual “State Of The Map”. This year it was in sun-baked Girona. “State Of The Map 2010 felt like a coming together of all my OpenStreetMap friends from around the world” Read my more detailed write up over on my user diary. There was a diverse variety of talk topics, from OpenStreetMap technical nitty-gritty, to big business GIS uses, to worldwide travels and humanitarian mapping. The full list of sessions is here. My talk this year was part of the “community track”.

Party Time! Good and bad ways to run OpenStreetMap mapping parties

UPDATE: Video of the talk is now available

I seem to have become the chief event organiser for OpenStreetMap in London, not because people massively admire the way I do it, but because it’s actually fair amount of effort, and I’m the one who got suckered into doing it. So this talk was mostly about my experiences of running these regular “mapping party” events, which we do every two weeks as a “mapping party marathon” (Sounds interesting? Check out when the next one is!)As I stressed in my talk, my approach is not ideal. There’s lots of things I don’t get around to doing. In particular I haven’t really tried to drum up press coverage of events. For one reason or another we never have very much luck at attracting new poeple. Although we try to be welcoming to new faces, it mostly ends up being a fun social meet-up where people know eachother. In the questions I was asked “what are my ideas for attracting new people?” to which I gave a hand-waivey response, but the truth is I don’t really know.


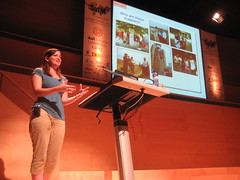
So I thought it counterpoised my talk quite nicely when Thea Clay got up and talked about outreach to non-technical communities and spoke about some of the successes she has had reaching out to local community groups and attracting new people to mapping parties in the U.S. This seems like a direction we need to go in, and I hope to find time to try this more in London. But then again…

Ultimately I think the most important message she had, was that OpenStreetMap is too difficult for non-techy people. They get the idea of creating open maps. They enjoy the outdoor aspect of data gathering, and they will have a lot of fun when you first take them out to do this, but the minute they sit down and take a look at our map editing tools “you can see the look on their faces change”.

Perhaps then the most important role of OpenStreetMap events, is to foster the existing OpenStreetMap community in an area. I would even go as far as saying that most outreach work at the moment should target boring old techy people and developers.

This is not the end game. We absolutely want to attract young people and old people, mothers and grandmothers, but getting techy people excited about OpenStreetMap is easier and actually far more effective than anything else at this stage. They’ll learn the tools quicker. But more importantly, these are the people who will go out and embed OpenStreetMap in their websites, taking it to new audiences, or if we’re really lucky they’ll go on to help solve the technical problems of OpenStreetMap and make the next useabilitiy break-throughs.

Obviously any publicity is good publicity. Any mapping party is a good mapping party, but I’m trying to consider where effort is best spent. Are we getting ahead of ourselves to try to engage with local community groups? Maybe I’m just working the geek angle, because that’s what I know best. As I said in my talk, press is important, and press (or PR?) is something OpenStreetMap needs to get better at.

Ruby code for converting to UK Ordnance Survey coordinate systems from WGS84?

Ruby code for converting to UK Ordnance Survey coordinate systems from WGS84? It’s one of those things I’d assumed would be a five minute search -> cut-n-paste job. But no. Well now you can cut & paste from here.

Using Proj4 and the proj4rb bindings

You can do all manner of coordinate projecting using Proj, and this is available within ruby code via proj4rb. To get set-up, install proj. On ubuntu you can do:

sudo apt-get install proj

download the proj4rb gem file (the ruby bindings), and install the gem:

sudo gem install proj4rb-0.3.1.gem

To use in a plain ruby script:

require 'rubygems'

require 'proj4'

To use in a rails app, add a line to your environment.rb file

config.gem "proj4rb", :lib => "proj4"

Probably all obvious to any pro-rubyist, but I got stuck at various stages of that. Anyway once you’re set up…

This code will do a conversion from WGS84 lat/lon to eastings and northings:

lon = -0.10322
lat = 51.52237

srcPoint = Proj4::Point.new(Math::PI * lon.to_f / 180,
                            Math::PI * lat.to_f / 180)

srcPrj  = Proj4::Projection.new("+proj=longlat +ellps=WGS84 +datum=WGS84 +no_defs")
destPrj = Proj4::Projection.new("+proj=tmerc +lat_0=49 +lon_0=-2 +k=0.9996012717 +x_0=400000 +y_0=-100000 "+
                                      "+ellps=airy +datum=OSGB36 +units=m +no_defs")

point = srcPrj.transform(destPrj, srcPoint)

puts "http://www.openstreetmap.org/?mlat=" + lat.to_s + "&mlon=" + lon.to_s + "&zoom=16"
puts "Converts to:";
puts "http://streetmap.co.uk/grid/" + point.x.round.to_s + "_" + point.y.round.to_s + "_106"

Originally I was trying just the ‘destPrj’ string, and calling the ‘forward’ method, but this seemed to be skipping the datum conversion, resulting in everything being 100m out. It seemed to be necessary to use the ‘srcPrj’ string and the ‘transform’ method, to get the datum conversion happening.

You can look up the mystical proj strings on spatialreference.org

(UPDATE)  If you’re interested in converting in the other direction, using the proj4 gem, see Peter Hicks blog: Converting OSGB36 (Eastings/Northings) to WGS84 (Longitude/Latitude) in Ruby

A pure ruby implementation

Like many naive developers who have gone before me, I started out thinking that these coordinate transformations should be acheivable with a few simple formulea, and was expecting to be able to copy & paste a block of ruby code from somewhere to do it without installing any gems.

I didn’t find any such code, but frustration with proj problems (before I got that working) led me to create a pure ruby solution, by porting this pure javascript code by Chris Veness into ruby. So there we go:

osgbconvert.rb – Conversion to Ordnance Survey coordinates in pure ruby

You can run it to see an example conversion with the output:

wgs84 lat:51.52237, wgs84 lon:-0.10322
http://www.openstreetmap.org/?mlat=51.52237&mlon=-0.10322&zoom=16
Converts to:osgb36 lat:51.5218609279112, osgb36 lon:-0.101610123646581

Converts to:easting:531691, northing:182090  As a grid ref:TQ31698209

http://streetmap.co.uk/grid/531691_182090_106

This includes ported code for Convert co-ordinates between WGS-84 and OSGB36 and ported code in one direction for OS Latitude/Longitude to OS National Grid (coordianate systems explained below) Also I haven’t faithfully stuck to what Chris’ functions return.

There is a bunch of maths, but it was quite a straightforward syntax conversion, and it comes in at about 150 lines of code. Somebody should do this for other languages. I’m sure other languages offer more beefy libraries equivalent to proj4. The main benefit of this is for quick copy & paste coding.

Mind you, if you are copying and pasting this, be sure to worry about the fact that it is LGPL licensed by Chris Veness [Update: It’s now shown under the more permissive CC-BY license on his website. Take your pick!]  For my part, you can credit me too if you like, but I don’t care.

I also came across another implementation, license unknown.

About Ordnance Survery coordinate systems

Chris Veness’s page is well linked because the code comes with a comprehensive description of what’s going on. However I misunderstood a few things even after reading it several times. Here’s my noddy guide to Ordnance Survey coordinate systems:

WGS84 is what I would call the “normal” latitude and longitude coordinate system. These days web developers passing around latitude and longitude values are normally using this. It’s what OpenStreetMap works with if you want to point to a location with a URL such as : http://www.openstreetmap.org/?mlat=51.52237&mlon=-0.10322&zoom=16 (the placr.co.uk office).

Ordnance Survey OSGB36 – Involves coordinates which are also called “latitude and longitude”. The numbers look very similar, and in fact if you get them confused and use one in place of the other, you’re generally only ~100 metres off. At this point I could mention “datums” and “ellipsoids”, but who cares? How do we fix it? With the above ruby code, use the function convertWGS84toOSGB36 (or convertWGS84toOSGB36 in the other direction)

Couple of formatting things to note: Both WGS84 and OSGB36 latitude & longitude values can be expressed in degrees and minutes rather than decimal, and with N S E W letters on the end. For example 51°31′20.53″N 000°06′11.60″W If longitude has a W on the end it would more “normally” be a negative number. The letters on the end do not make this an “Eastings/Northings” coordinate. That’s a different system…

Ordnance Survey National Grid Reference Eastings and Northings look totally different. For the placr office the easting is 531691. The northing is 182089. On these numbers the first digit is special. It’s identifying which “grid” square we are in, counting from zero. Everything in London is in grid square 5,1

National Grid References with letters are the older more human friendly version of that. So “TQ 3169 8208” is the equivalent. The 5 and 1 are removed, and instead we represent the grid square separately at the front. Everything in London is in grid square “TQ”. Just to munge things together a bit more, we might drop one digit of precision and drop the spaces to give “TQ316820”.

Don’t ask me how Landranger sheet numbers fit in. I’m going back to my WGS84 thankyou very much.

Paul Downey and London Wiki Wednesdays

Last Wednesday was London wiki wednesday again. We struggled a bit with organisation this time. The usual to’ing-and-fro’ing around finding sponsors and hosts was confounded by a problem with the website. SocialText foolishly switched it to be hidden from… well the web… which really doesn’t help when you’re trying to promote an event. Despite these difficulties, enough people came together at NYK to make for a decent gathering, with some interesting presentations. Actually the low attendance makes for some nice face-to-face group discussions.

For me the highlight was chatting with Paul Downey. I’ve run into him once or twice before, and was familiar with tiddlywiki, which he presented again. This is a somewhat wacky animated javascripty tool which is quite different in it’s interface and behaviour compared to “normal” wikis. Surely the work of an evil genius…

But it turns out Paul Downey is also responsible for this remarkable creation:

see it bigger to read the funny labels. Also with annotations on flickr.

A fascinating cartoony metaphorically abstracted representation of web technologies. I came across this a couple of years ago, while I was still an integration consultant, and I found the “SOA tower of babel” particularly amusing (and accurate)

Aid Information Challenge

I’m at the Aid Information Challenge day watching the final hack presentations. This seems to be part of a series of hacking events happening at the Guardian offices, following on from rewiredstate National Hack the Government day (where I made the find my nearest registry office/hospital thingy).

The idea is to get techy types to meet with people from other areas, in this case aid organisations, and look for ways to bring their skills to bear, preferably in the form of super-quick super-agile thrown-together-on-the-day “hacks” which get presented at the end. I probably should have got more involved in a mapping hack. There was a fair bit of this going on, and I got into a few conversations. Lots more potential for OpenStreetMap hacking and promoting OpenStreetMap by getting it into projects.

Instead though. I mostly busied myself with throwing together this slide deck “OpenStreetMap For Aid Information” which I then presented:

OpenStreetMap For Aid Information

I originally thought I’d have two minutes to talk at the end of the day, but I actually talked for 20 minutes as a side-line talk during the day.The main emphasis of my talk was on two nice recent aid information examples Haiti and Kibera. Some related links:

I also mentioned London events.